
Introduction
My research has led me to higher expected returns and increased diversification of my existing models through the addition of a new model using leveraged growth stocks. It does this by utilizing breadth, trend, mean reversion, and portable alpha. The result is that a modest allocation to the new model can increase prospective returns dramatically without a concomitant increase in volatility. I no longer need to incorporate cryptocurrencies or other highly aggressive approaches into my portfolio.
Bitcoin Characteristics
In my last blog post, I pointed out how bitcoin’s price movement is like that of other risk-on assets. Here is an updated chart showing the performance of BTC and the S&P 500 since 2012.
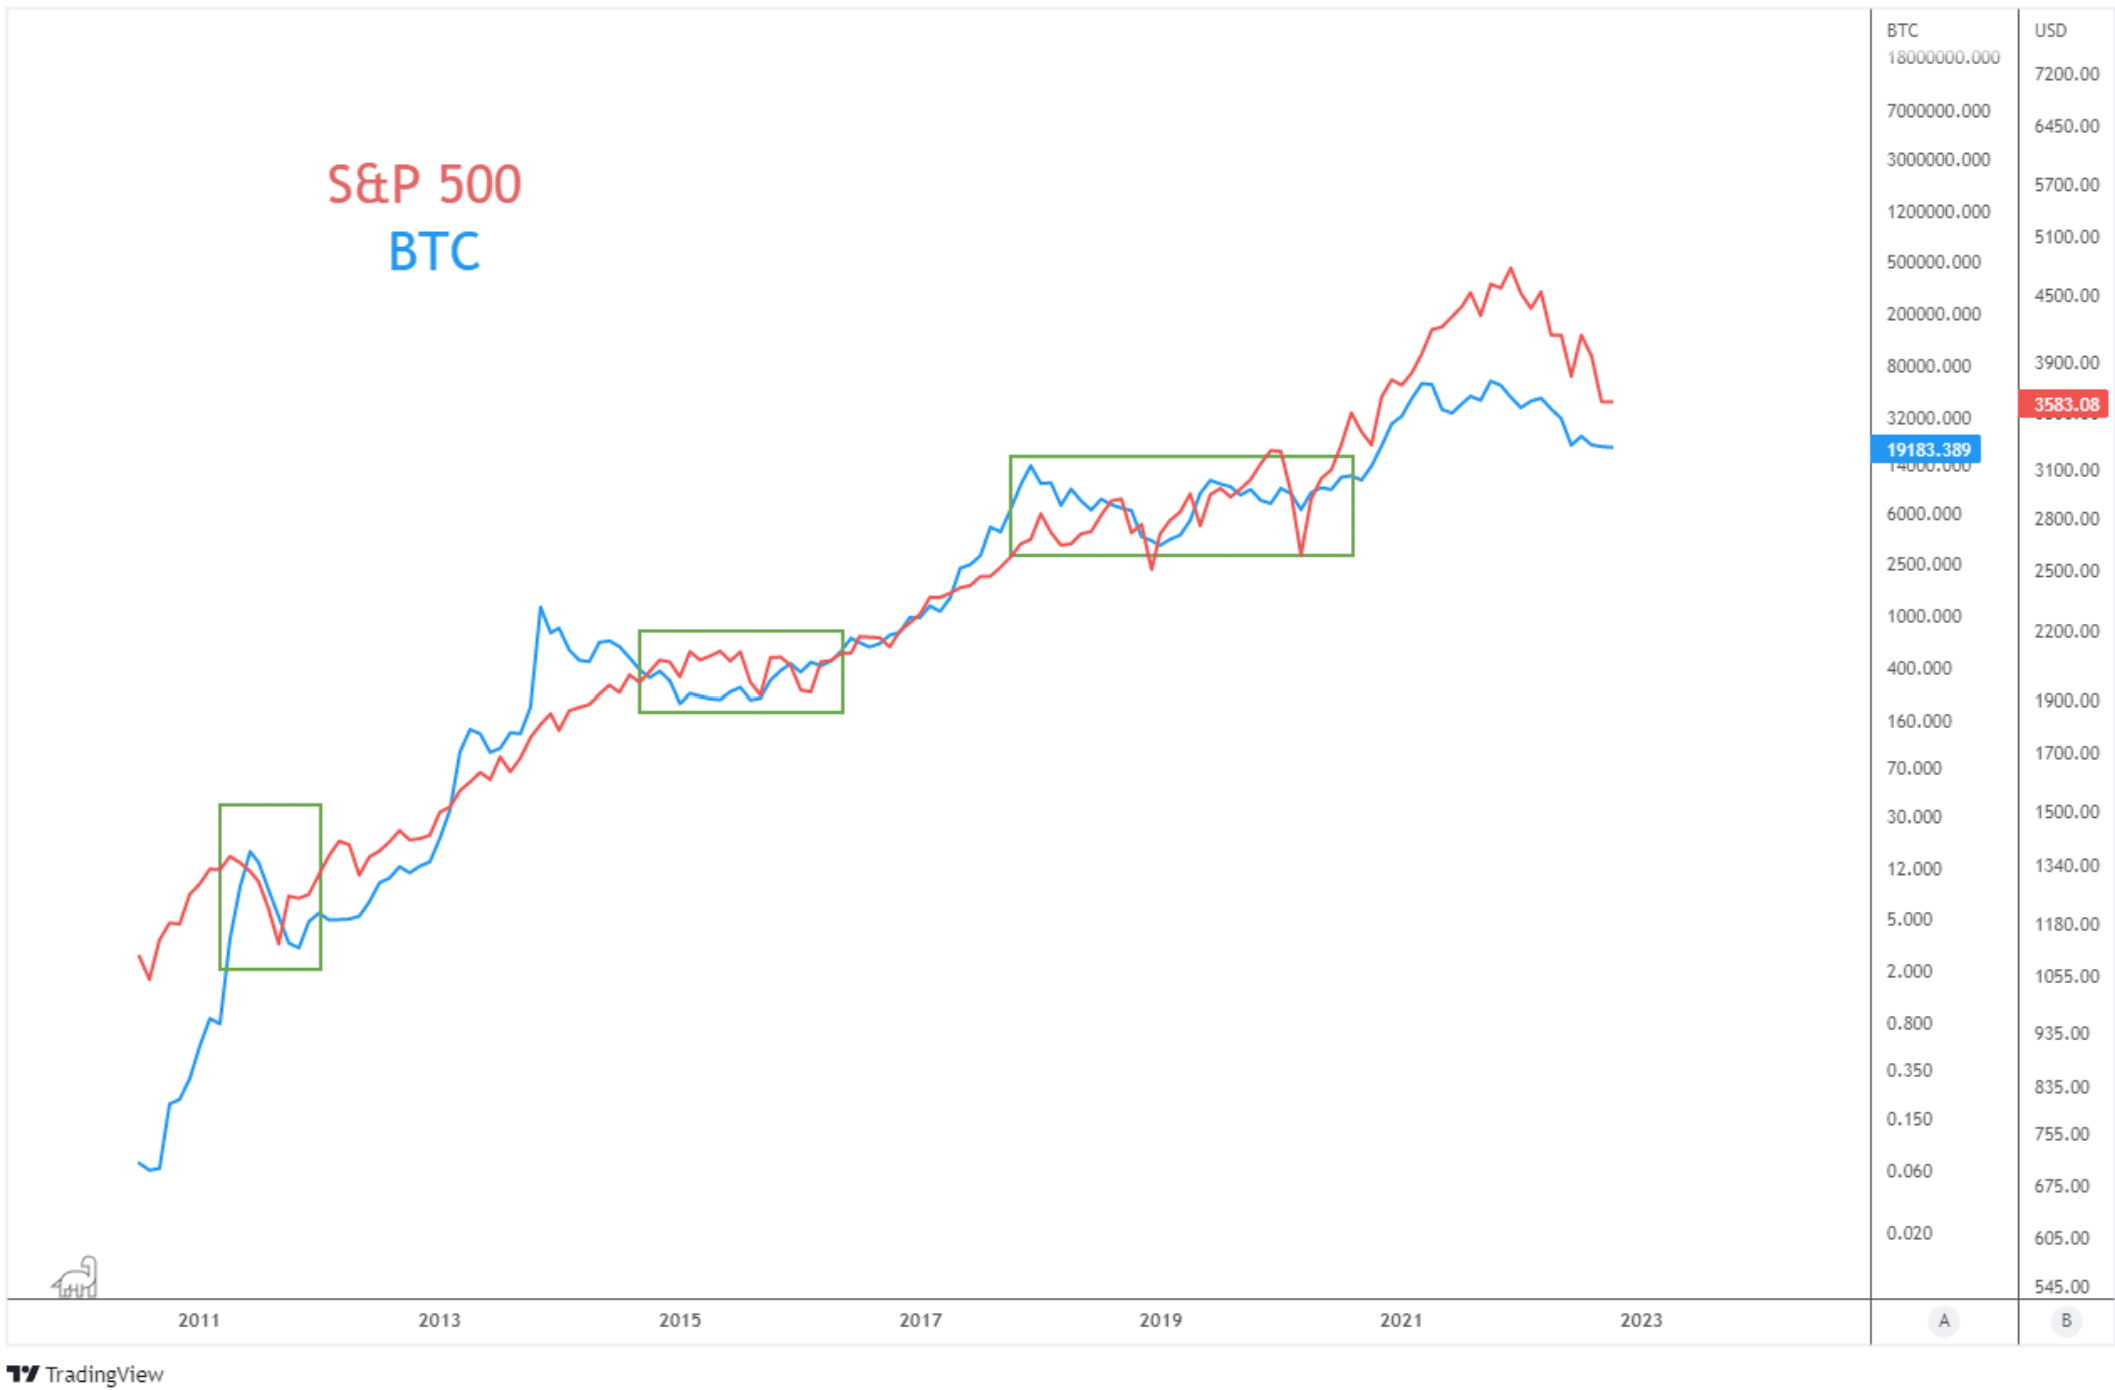
This relationship exists both longer and shorter term. I used to check the futures market before the stock market opens each day to get a sense of the market’s direction. Now I check bitcoin instead.
Bitcoin attracts many investors because of its salient, lottery-like payoffs. Bitcoin reflects speculative fervor. We see that here in comparing bitcoin’s price to the spread between high beta and low volatility stocks.

Bitcoin Substitute
Given these similarities, we might want to find a substitute for bitcoin. Why is that? First, there are only ten years of usable bitcoin data. Limited data makes it hard to have confidence in systematic approaches for trading bitcoin. Second, it is hard to use anything other than price action for trading bitcoin. With the stock market, there are other explanatory variables that one can use. Finally, is a concern about bitcoin’s continuing impact on climate change.
The White House Office of Science and Technology Policy recently reported that global bitcoin mining consumes as much energy as all computers and all residential lighting in the U.S.
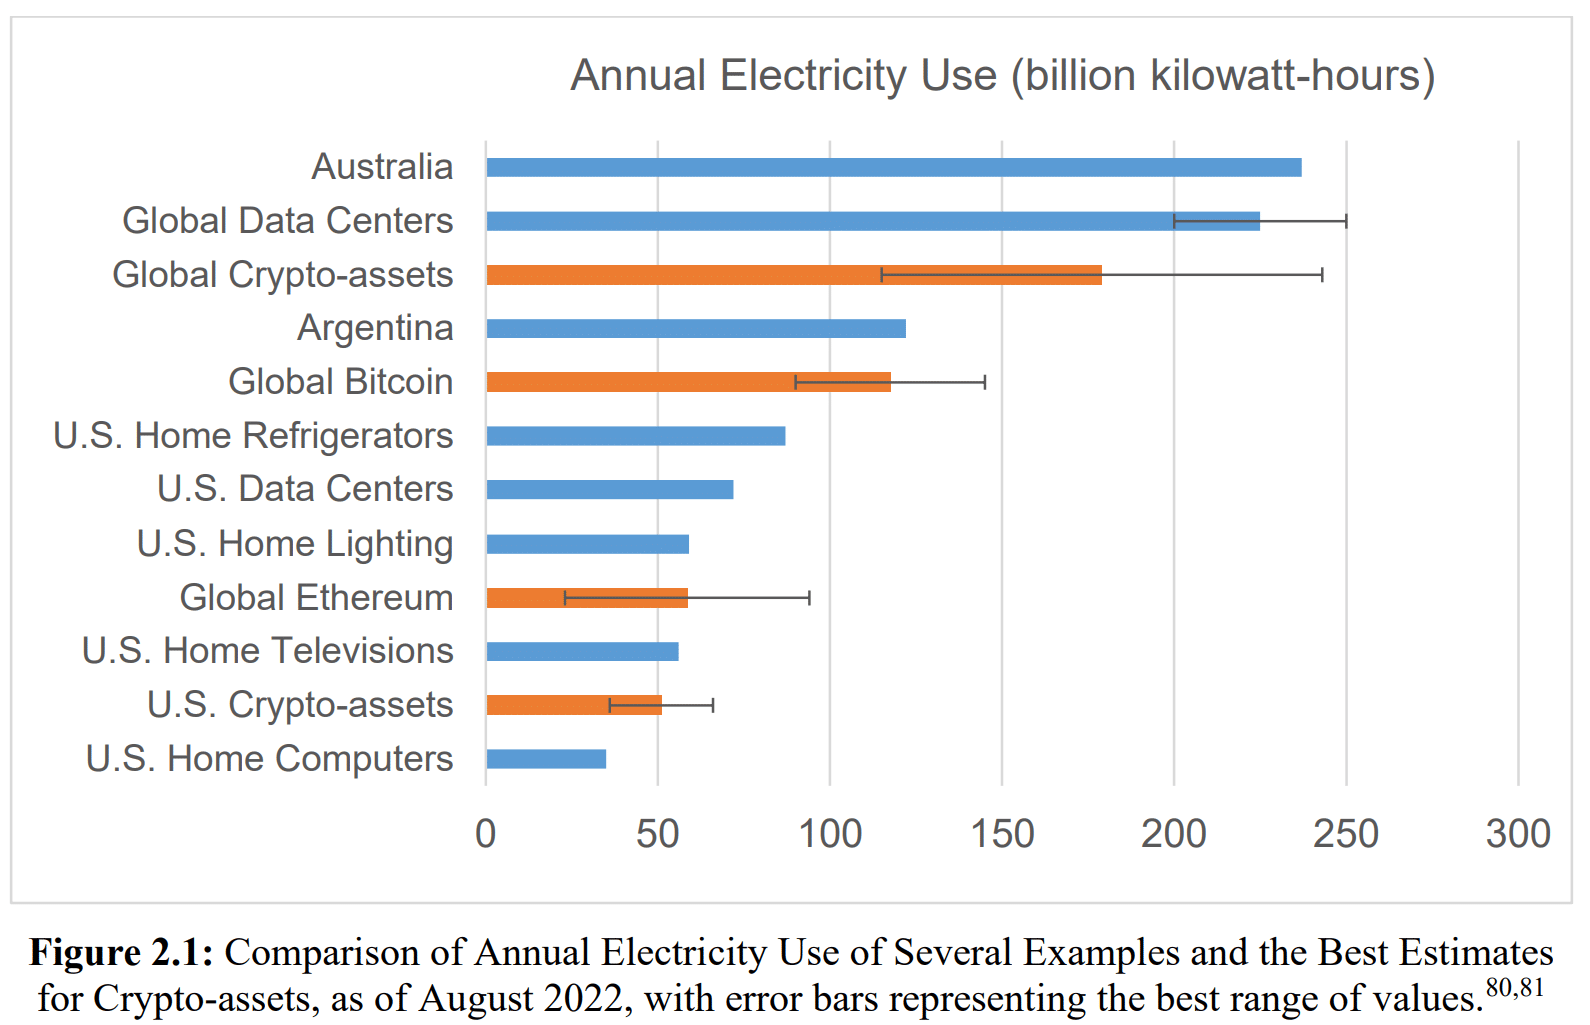
Crypto mining produces 110-170 metric tons of carbon pollution across the world and 25-50 metric tons in the U.S. Global crypto emissions are greater than those of many countries. Bitcoin generates two-thirds of these greenhouse gas emissions.
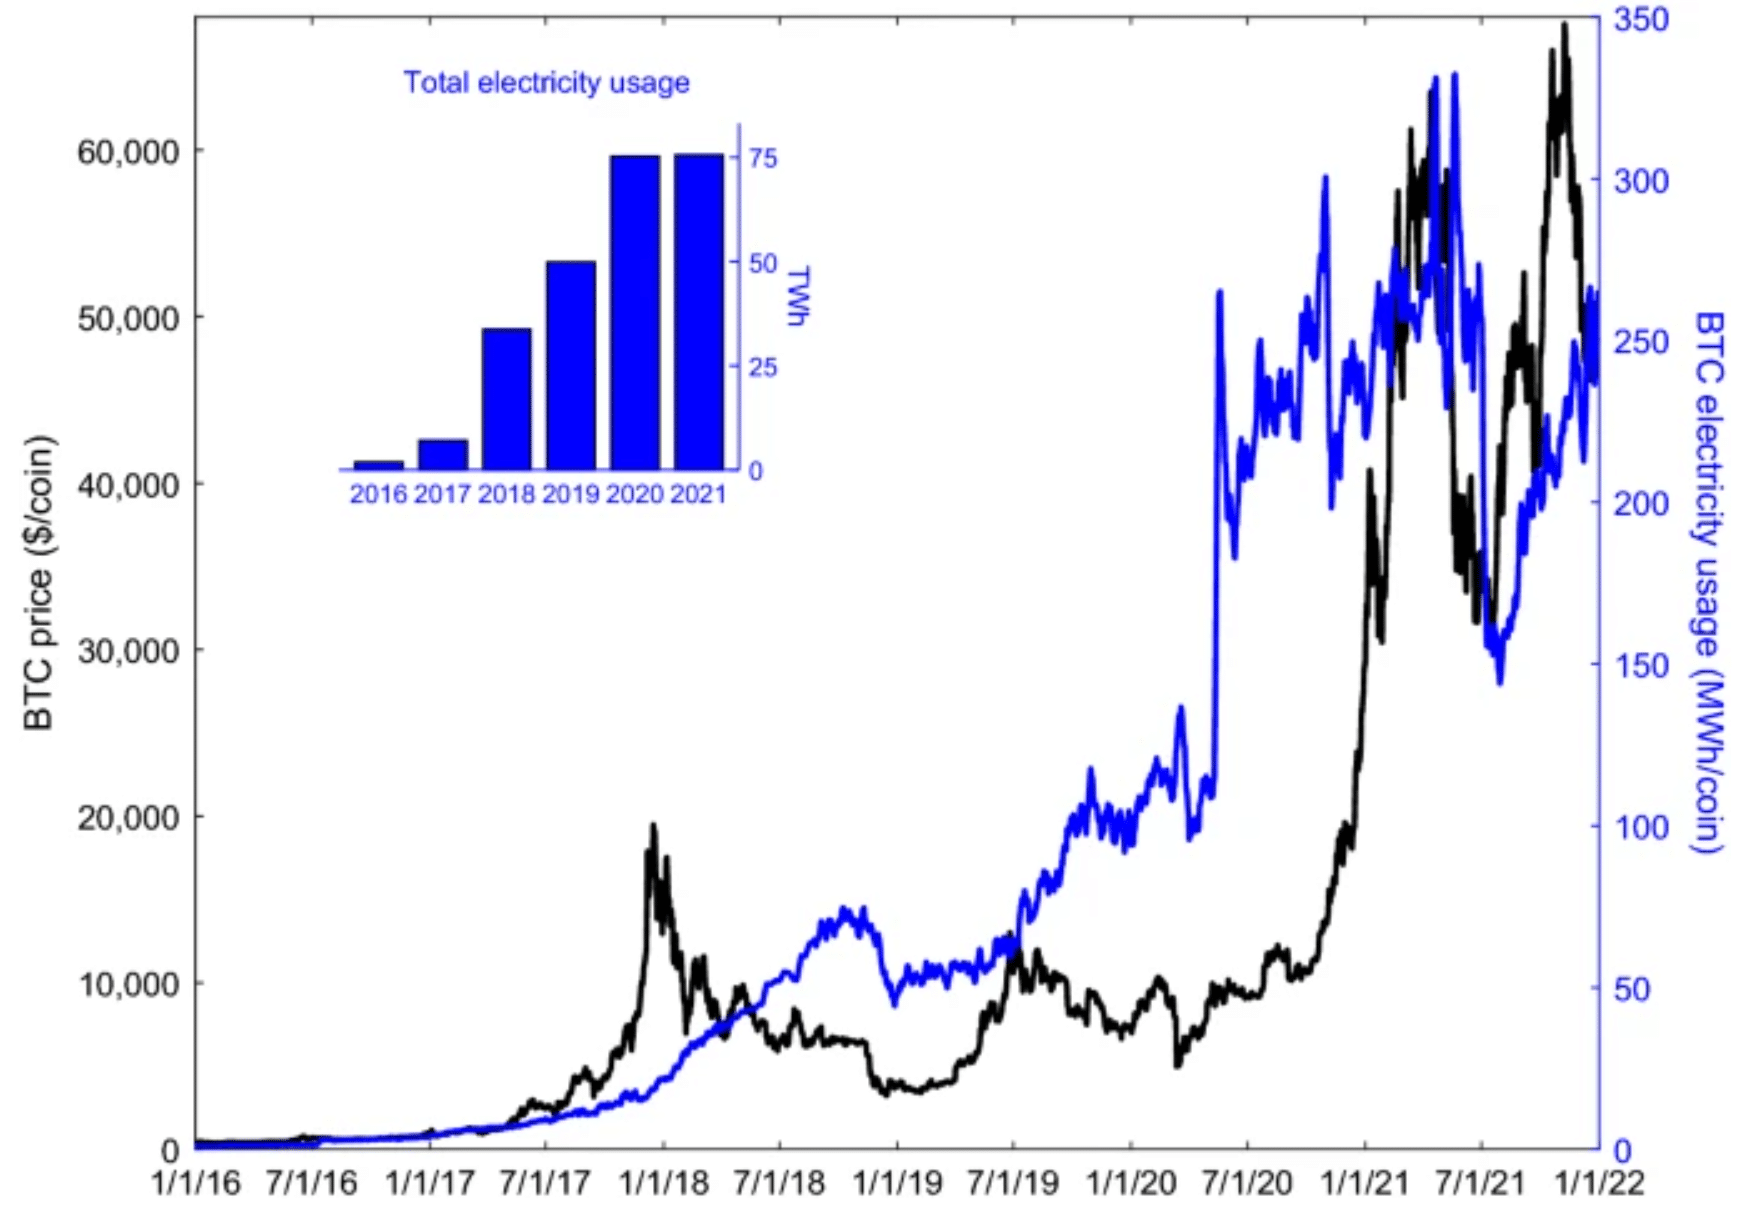
There was a similar study recently in the journal Nature.
A Sensible Alternative
Bitcoin’s performance has tracked the performance of growth and technology stocks. Here is how BTC matches up with the MicroSectors FANG+ Index 3X Leveraged ETN (FNGU).
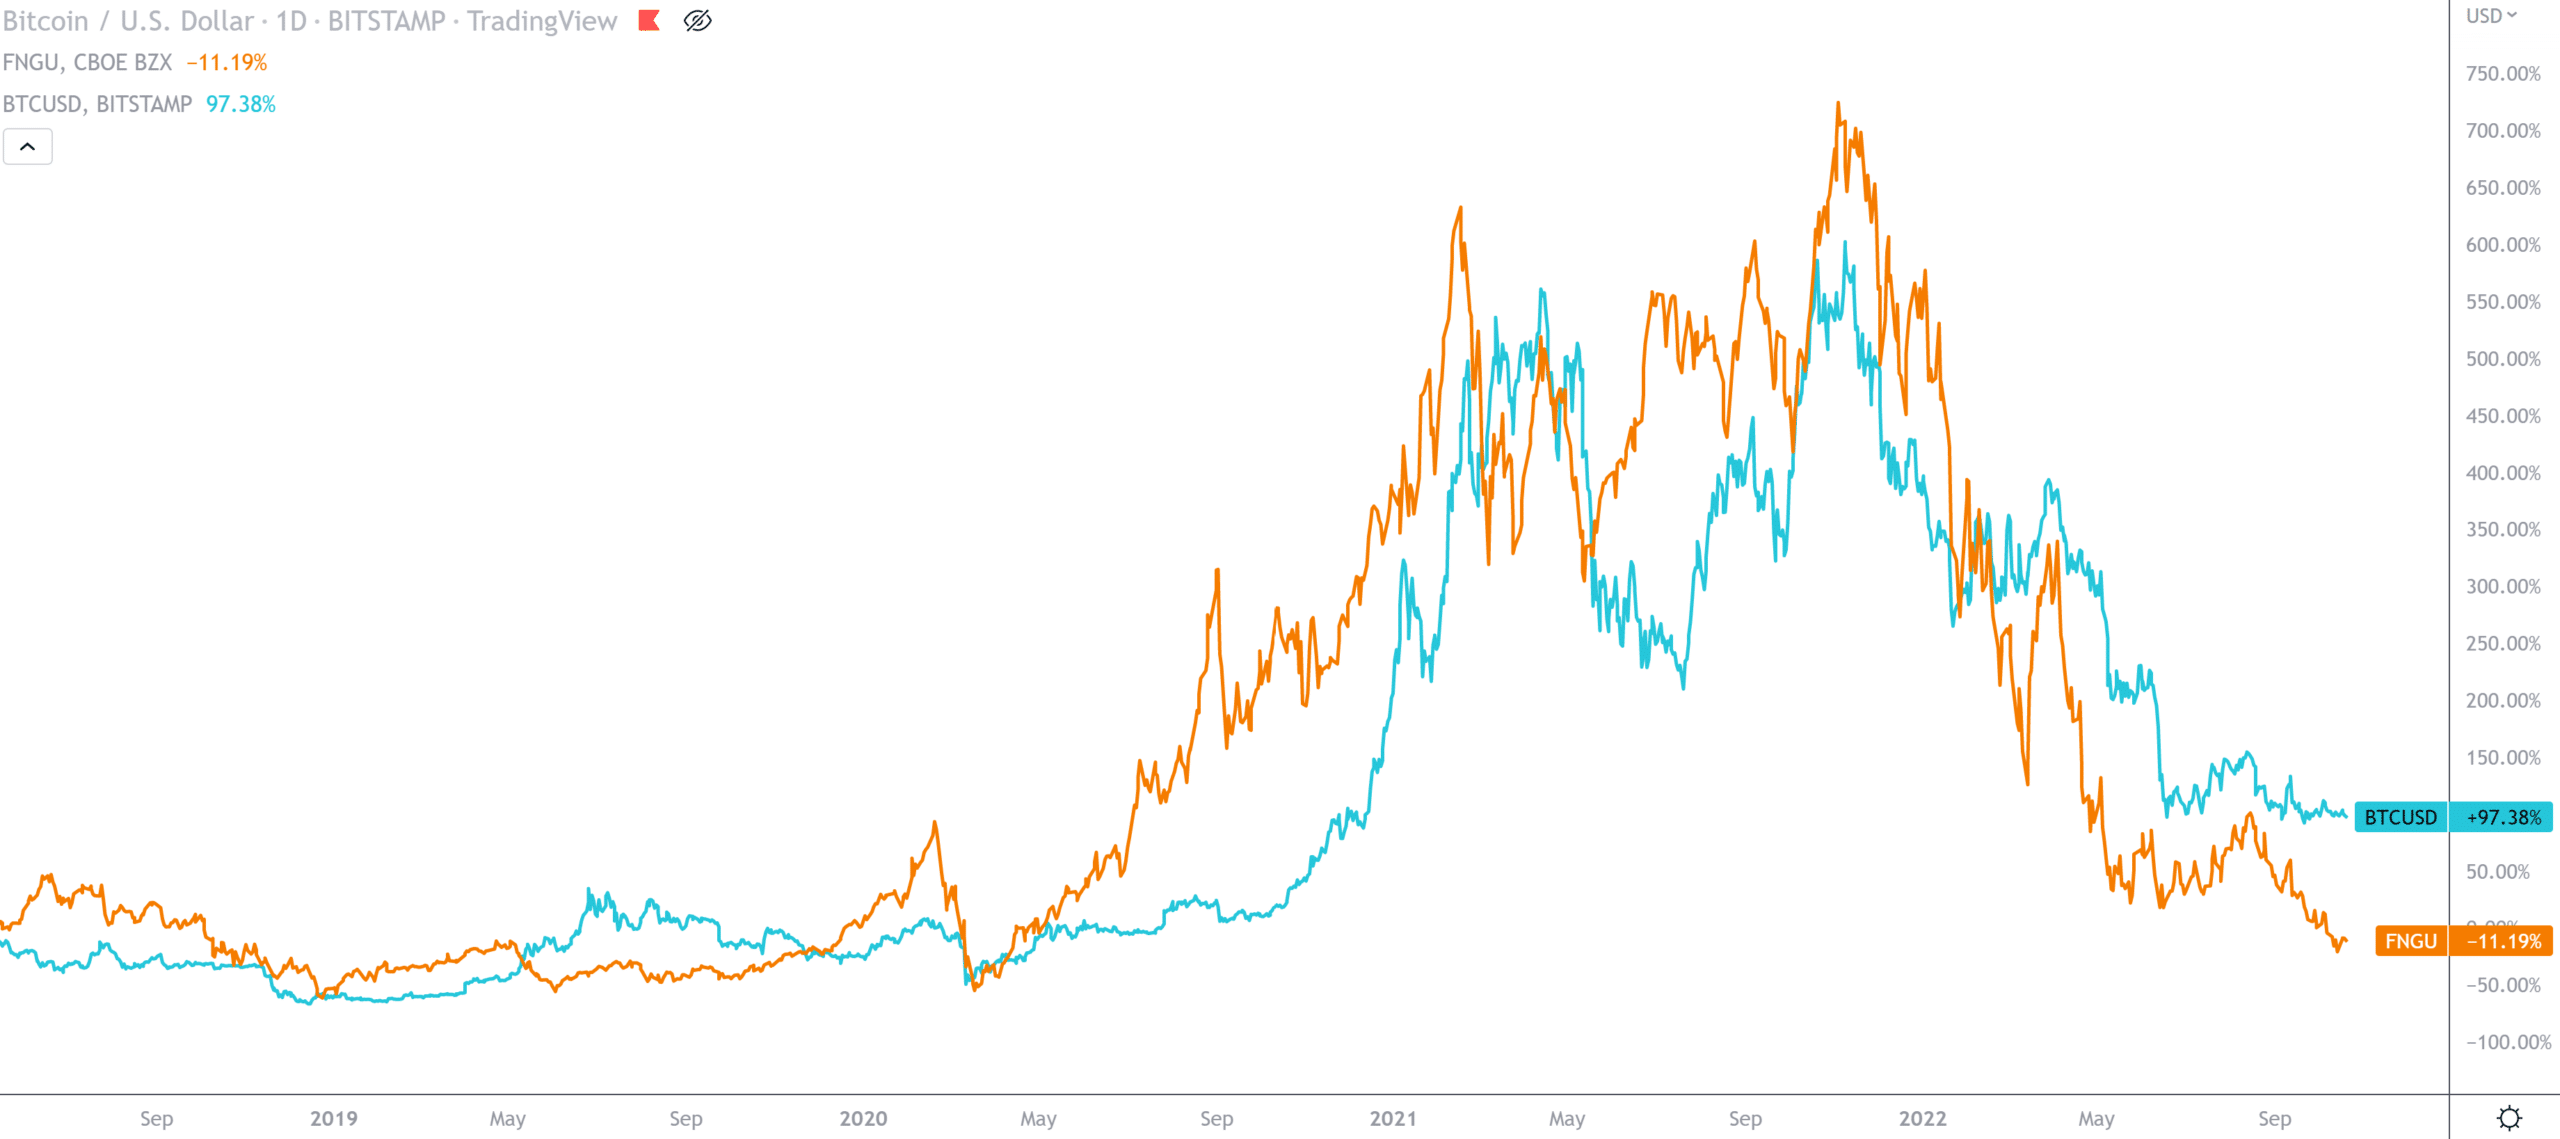
FNGU holds growth and technology stocks on a leveraged 3-to-1 basis. FNGU here looks like a good proxy for BTC. A problem here is the tracking error of 3X leveraged funds. Most leveraged funds rebalance their positions daily. This can lead to tracking errors and poor reward-to-risk characteristics if you hold these over longer periods.
Many think this is true of all leveraged funds. But an academic study shows 2X leveraged long funds exempt from this problem if holding periods are under one year. My research confirms this finding.
2X Leveraged QQQ
There is no 2X FANG fund, but there is a 2X NASDAQ 100 one, the ProShares Ultra QQQ (QLD). It has 47% of its assets in technology growth stocks similar to FANG. Eight of its top 10 holdings are the same in each fund.
QLD has several advantages over bitcoin for speculative trading. First, QLD has twice as much data for system validation. Second, there are factors other than price action we can use as QLD trading inputs. For example, we found NASDAQ Composite breadth to be an important addition to our QLD trading model.
Examples of breadth are advancing versus declining issues, advancing versus declining volume, and new highs versus new lows.[i] Breadth can help us identify underlying strengths or weaknesses that may not be obvious from looking only at price action. For trends to be sustainable, market internals like breadth need to confirm price movement.
Mean Reversion
The final element we can add to a stock market-based alternative for bitcoin is short-term countertrend mean reversion.[ii] These trades happen when the NASDAQ becomes extremely overextended.
Stocks have intrinsic value. When excessive fear or greed takes stock prices far beyond their intrinsic value, saner minds step in to bring prices back toward equilibrium. It is hard to find intrinsic value and equilibrium with bitcoin. It can move to an extreme and continue moving in the same direction.
Our Snap Back model has done mean reversion trading with over 100 ETFs for over 3 years.
NASDAQ Breadth, Trend, and Mean Reversion Model
We have combined breadth, trend, and short-term mean reversion into a trading model. We call it NASDAQ Breadth and Trend (QBAT). QBAT uses only daily data, is in QLD 69% of the time, and averages 3.9 trades per year. Results begin in August 2006 soon after QLD started trading.

Results are not a guarantee of future success and do not represent returns that any investor attained. Performance includes reinvestment of interest and dividends. Positions are rebalanced monthly. Leveraged ETFs have high risk and extreme volatility. We apply dual momentum applied to bonds and alternative assets when QBAT is not in QLD. See our Disclaimer page for more information.
All Weather Model
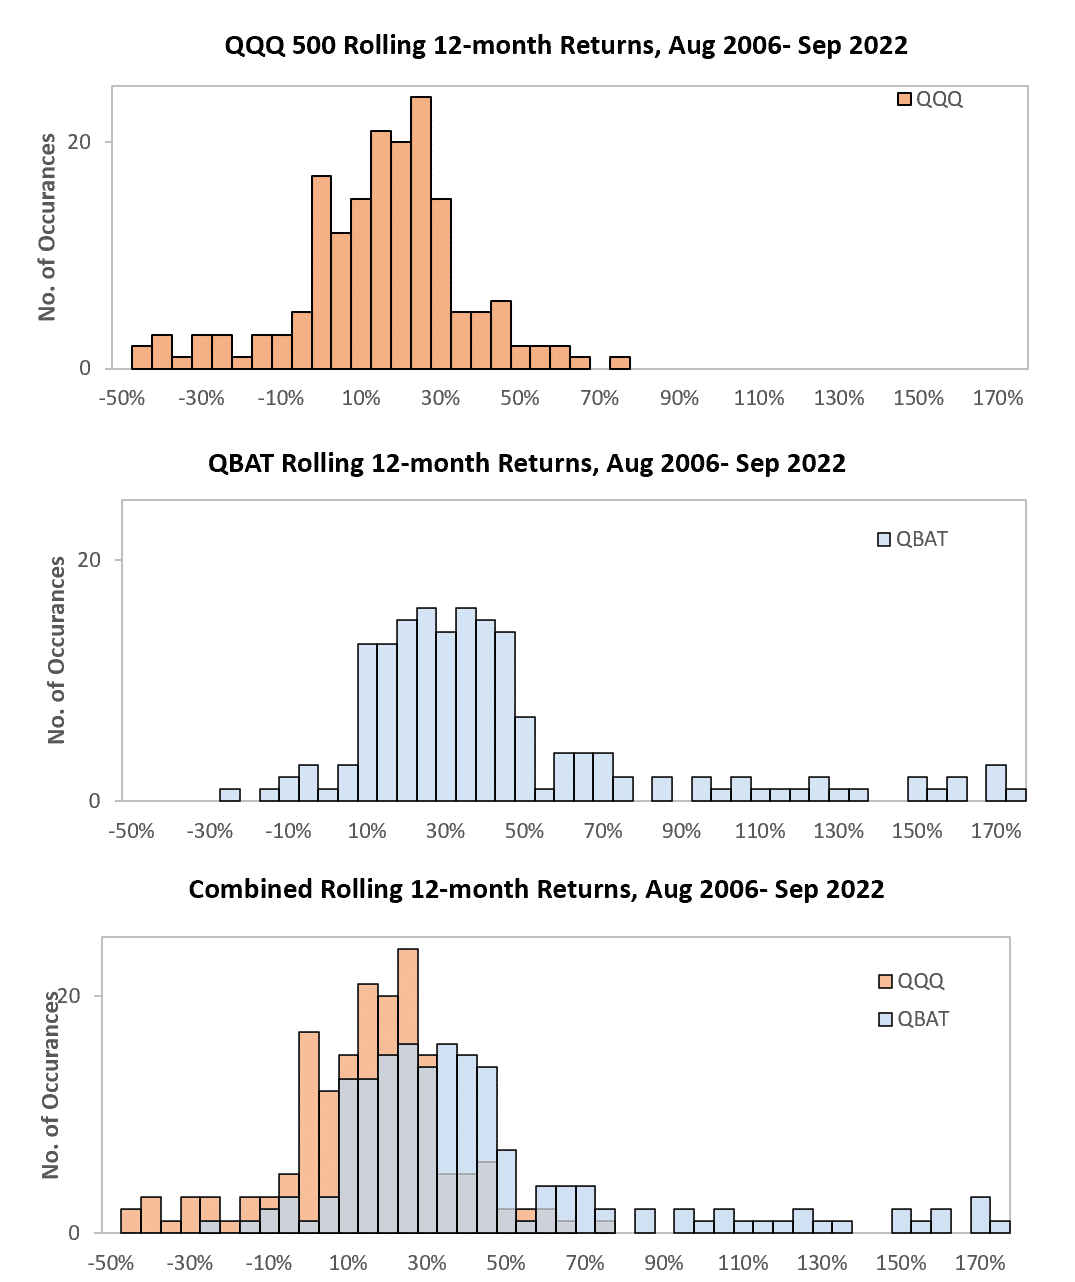
Most trend-based strategies that outperform do so because they lose less in down markets. They often lag their benchmarks during strong bull markets. We designed QBAT to do well in all market environments. Here are monthly QBAT returns divided by benchmark returns.

Portable Alpha
Portable alpha (aka return stacking) is an approach long used by institutional investors. It applies leverage to assets or approaches that are not highly correlated and that have different reward-to-risk characteristics. Portable alpha can boost expected returns while keeping volatility at an acceptable level.
Here we see modest monthly correlations of QBAT with two of our other proprietary models, Enhanced Global Balanced Momentum (E-GBM) and Advanced Global Equities Momentum (A-GEM).
| QBAT | A-GEM | E-GBM | S&P500 | QQQ | |
| QBAT | 1.00 | 0.55 | 0.50 | 0.50 | 0.61 |
| A-GEM | 1.00 | 0.64 | 0.38 | 0.36 | |
| E-GBM | 1.00 | 0.49 | 0.49 | ||
| S&P500 | 1.00 | 0.93 |
I used portable alpha plus modern portfolio theory when I managed commodity hedge funds in the 1980s. I cross-collateralized the accounts of traders like Paul Tudor Jones, Louis Bacon, Monroe Trout, Al Weiss, and John W. Henry. They were volatile but had diverse trading approaches and low correlation.
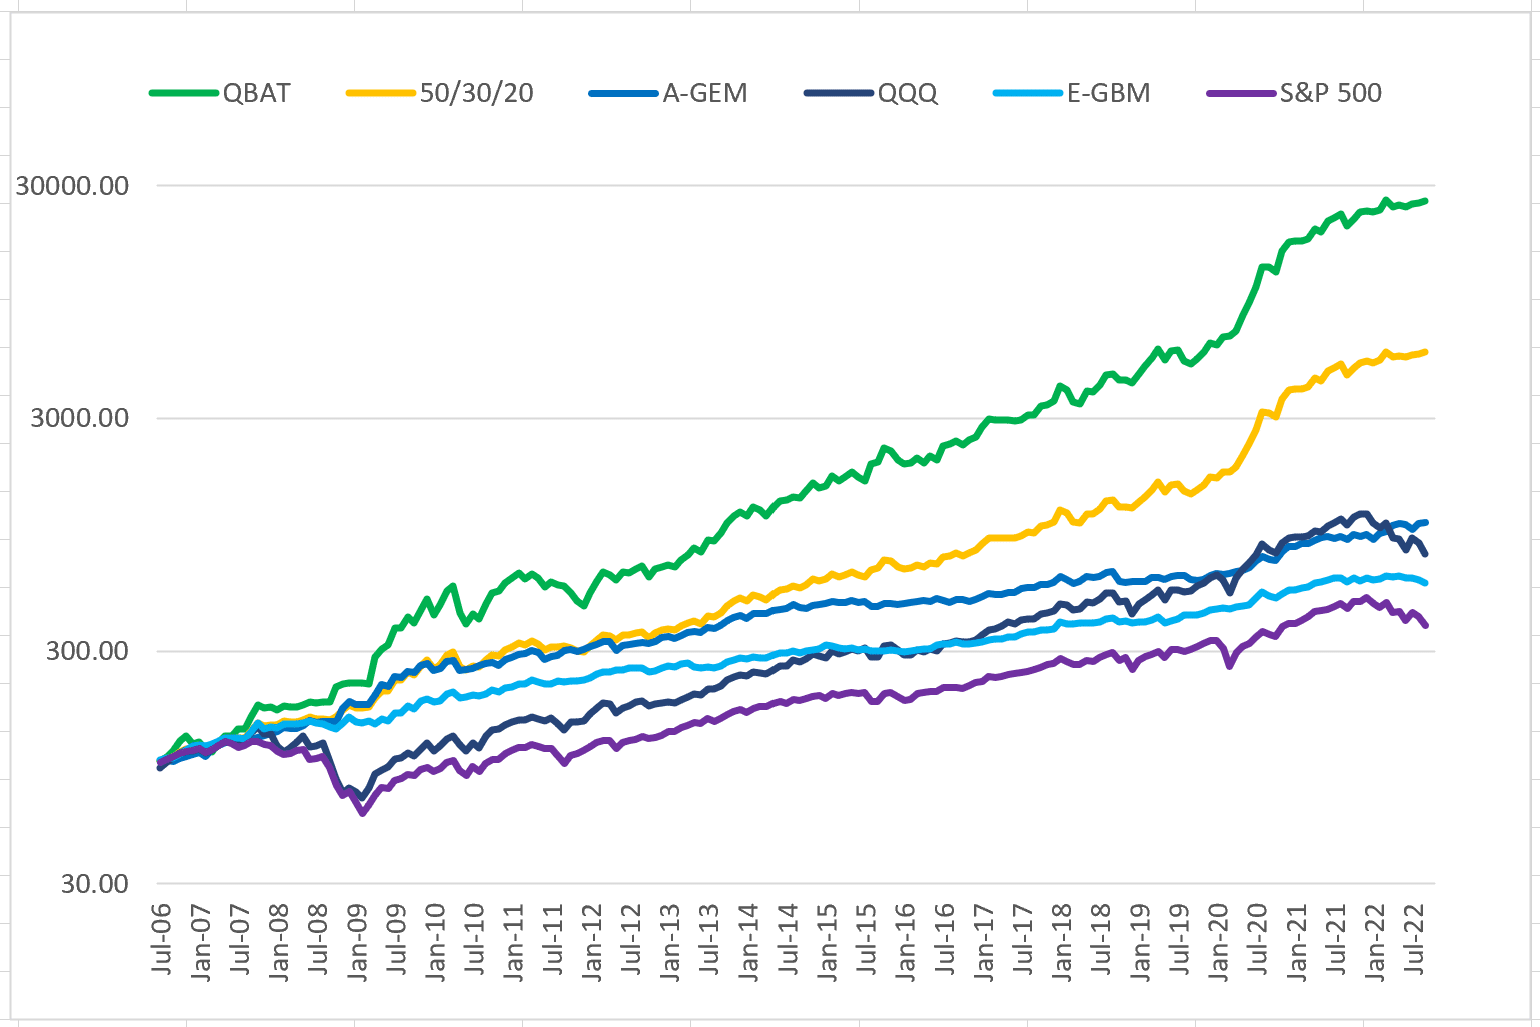
QBAT, with its inherent leverage and modest correlation to other models, gives us a similar opportunity. Here are the back-tested results of QBAT compared to some benchmarks and our other models. We also show 50%/30%/20% and 50%/40%/10% allocations to E-GBM, A-GEM, and QBAT.
| QQQ | S&P500 | E-GBM | A-GEM | QBAT | 50/30/20 | 50/40/10 | |
| CAGR | 13.8 | 9.4 | 10.7 | 15.9 | 40.6 | 18.2 | 15.8 |
| STD DEV | 19.6 | 17.9 | 7.8 | 10.7 | 24.2 | 10.5 | 9.3 |
| SHARPE | 0.77 | 0.59 | 1.36 | 1.44 | 1.55 | 1.66 | 1.63 |
| ULCER IDX | 13.56 | 13.70 | 2.32 | 3.05 | 5.38 | 2.68 | 2.51 |
| MAX DD | -50.2 | -52.9 | -7.4 | -11.1 | -22.5 | -10.7 | -9.5 |
| AVG DD | -7.0 | -7.4 | -1.4 | -1.7 | -2.9 | -1.4 | -1.3 |
| W% MOS | 66 | 66 | 68 | 69 | 69 | 70 | 70 |
A 20% QBAT portable alpha allocation more than doubles the expected return of an equal A-GEM and E-GBM portfolio while keeping volatility at a reasonable level. Even a 10% allocation to QBAT has a meaningful impact on expected performance. See our Proprietary Models Performance page to see other ways of using QBAT.
Results are not a guarantee of future success and do not represent returns that any investor attained. Performance includes reinvestment of interest and dividends. Positions are rebalanced monthly. Leveraged ETFs have high risk and extreme volatility. Table updated February 2023. See our Disclaimer page for more information.
Contact us for more information about QBAT and our other proprietary models.
[i] For more on breadth, see Morris, Gregory L (2015), The Complete Guide to Market Breadth Indicators: How to Analyze and Evaluate Market Direction and Strength, McGraw-Hill.
[ii] For an academic validation of short-term mean reversion, see Lehmann (1988), “Fads, Martingales, and Market Efficiency.”