We designed our public dual momentum model, GEM, to be simple and easy to use by do-it-yourself investors. GEM exists to help protect smaller investors from significant drawdowns while allowing them to earn returns that exceed the market over the long run.
But momentum works best when it incorporates multiple trend determinants. There is a synergistic effect from doing that.
Most investors do not give enough importance to price trends. Greyserman & Kaminsky show that simple trend following has outperformed buy-and-hold and reduced downside excursions back to the beginnings of many markets. No other investment factor has shown that.
Our models are the culmination of a lifetime of investment research and experience. Three of our four proprietary models use a channel breakout approach validated on 100 years of data in this research study. That gives us high confidence in this approach. Richard Dennis taught something similar to this to his “turtle traders.” Jack Dreyfus became a billionaire using channel breakouts of stocks making new highs. Most of our models also incorporate mean reversion as a complement to trend following.
All our models use daily data and are highly adaptive to market conditions. They are based on rigorous, academic-quality research with out-of-sample validation on at least 100 years of data. This in contrast to many other trading models that overfit limited amounts of data.
We spend considerable time on due diligence to find the best ETFs suitable for our models. Most investment approaches also do not spend enough time on portfolio construction. Thoughtful portfolio structuring is an essential part of our investing process.
Our models work in many markets. We chose ones so that their combinations create balanced portfolios responsive to different market conditions. Multiple models with low to moderate correlation are the best way to reduce model estimation error and uncertainty. Optimal combinations of models enhance expected returns while reducing downside exposure.
We license our proprietary model signals to substantial private and institutional investors, as well as to select investment advisors who understand and appreciate what we do.
Most trading models exit to a safe harbor asset when not in their risk-on positions. Our models are unique in that they switch to other assets or models with positive trends before seeking a safe harbor. This layering captures additional profits and helps reduce whipsaw losses. Here are our current proprietary models.
Bond & Equity Anomaly Systematic Trading (BEAST)
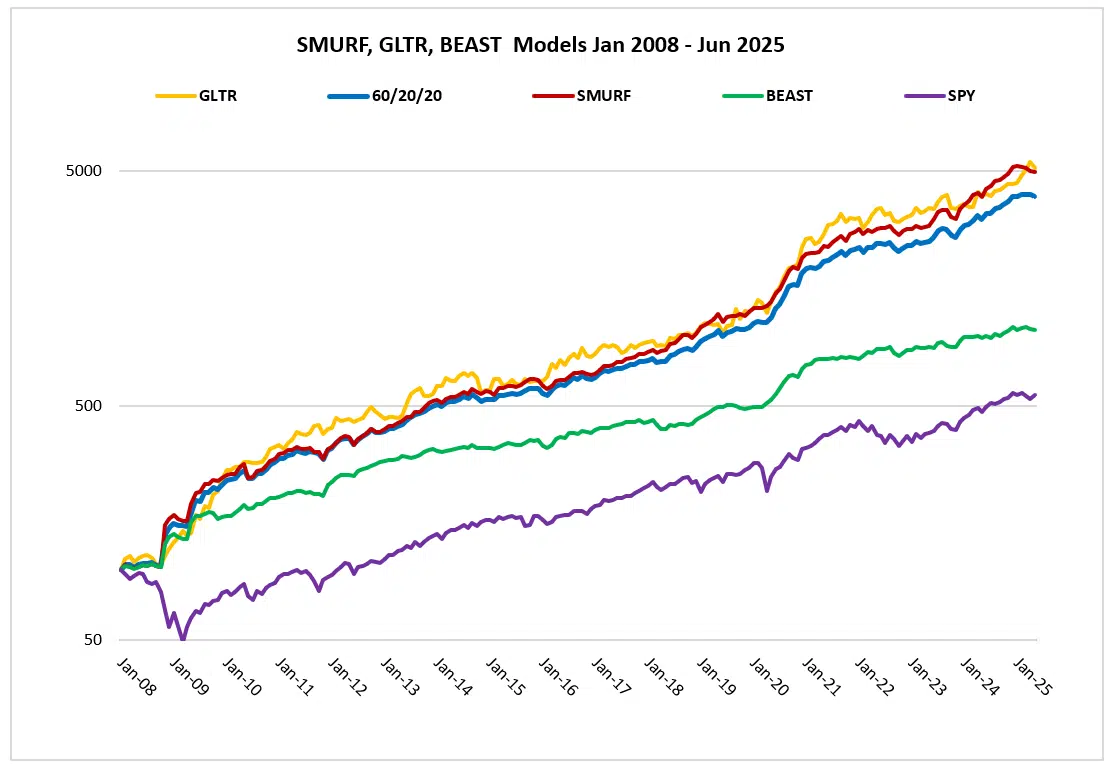
BEAST holds intermediate, short-term, or convertible bond ETFs when their trends are positive. Otherwise, BEAST holds Treasury bill equivalents. BEAST occasionally engages in short-term trades of emerging market or other stock market ETFs to exploit mean reversion and the turn-of-the-month seasonal effect.
Gold Long Trend (GLTR)
GLTR applies trend following to gold ETFs. Gold is often mean-reverting and challenging to trade, but our trend strategy handles it well. GLTR holds the SMURF positions when not in gold. SMURF can also hold a gold mining ETF to exploit the turn-of-the-month effect. Even without trend following and mean reversion, gold has outperformed the S&P 500 over the past 25 years.
Blockchain and Digital Asset Synergistic System (BADASS)
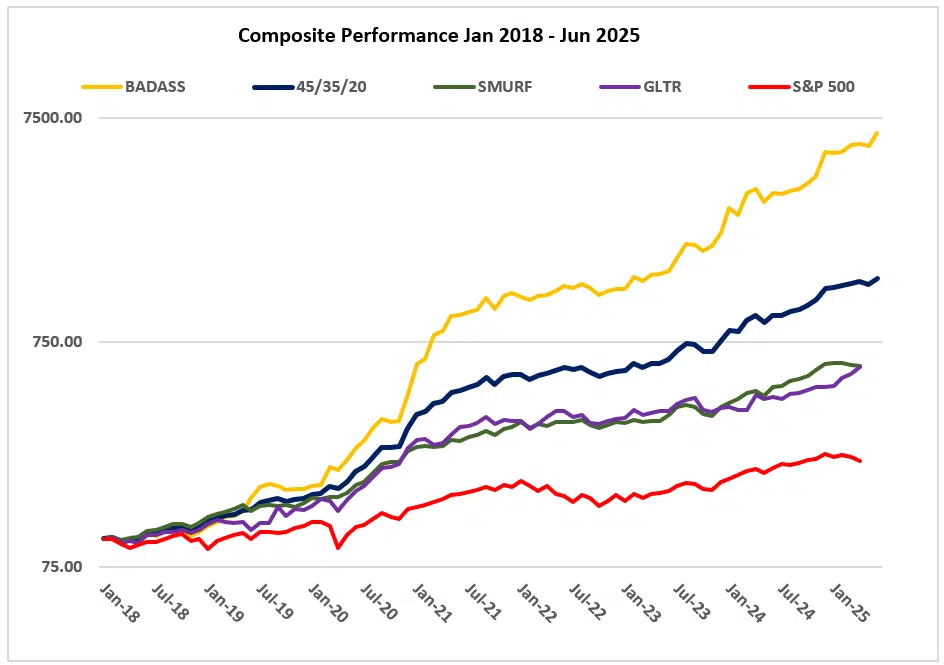
BADASS applies our trend model mainly to the BLOK ETF, representing blockchain technology stocks. It also allocates smaller amounts to spot Bitcoin and Ethereum ETFs when their trends are positive. This combination gives better risk-adjusted results than any of them alone. When not in these ETFs, BADASS holds the GLTR or SMURF positions. BADASS is our most profitable model.
Stock Market Upside Reversal Factor (SMURF)
SMURF is a stock market oriented model that combines mean reversion with trend and seasonality. It buys large-cap growth stock ETFs when their trends are positive. SMURF exits them when their trends are no longer positive or on abnormal strength. When not in growth stock ETFs, SMURF holds the BEAST bond positions.
Here are the results of our SMURF, BEAST, and GLTR models since 2008.


