One risk is that the future may not be as good as the past, even though several hundred years of out-of-sample performance support both relative and absolute momentum. However, there are behavioral reasons why momentum has a good chance to continue working since behavioral biases are hard to change.
There is some risk that momentum will attract substantial capital and not work as well in the future because of too many participants. However, the index ETFs we usually use are more scalable than individual stocks. Behavioral biases may continue to keep investors away from dual momentum.
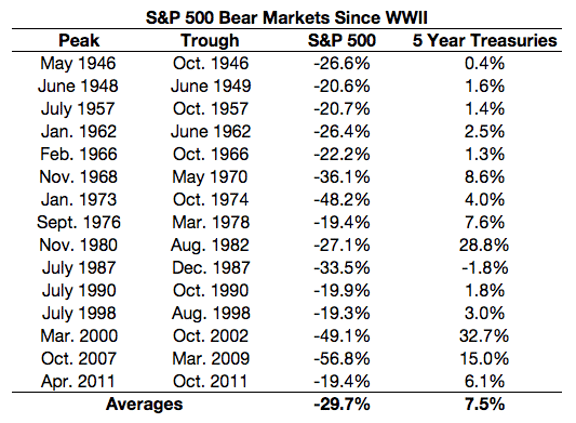
Much of the stock market’s short-term volatility still exists with dual momentum. When a new bull market begins after a bear market, there are re-entry lags. You should expect this from our public dual momentum model. We designed our proprietary models to reduce this transitional lag.
There is also the risk of tracking errors. No strategy outperforms all the time. The most significant risk factor may be that one becomes impatient or overly influenced by short-term performance, thereby abandoning their models at inopportune times. We see this happen more often than it should with those who do not take the time to properly educate themselves about momentum investing. This is why we provide plenty of research references in our book, blog posts, and proprietary model factsheets.
Please see our Disclaimer page for additional risk factors.