Corey Hoffstein of Newfound Research recently wrote an article called, “Fragility Case Study: Dual Momentum GEM.” Corey starts out by saying my dual momentum approach is the strategy he sees implemented the most among do-it-yourself tactical investors. Corey then said several investors bemoaned that GEM kept them invested in the stock market during the last quarter of 2018. It signaled them out of the S&P 500 at the beginning of January after the market was in a drawdown. This caused them to no longer follow the GEM signals as given.
Corey’s solution is to use many additional lookback periods to reduce the chance of “bad luck.” He showed the performance of seven monthly lookback periods ranging from 6 to 12 months. He presented a composite of those lookbacks that create seven different GEM models instead of one with a 12-month lookback.
Corey argued that his approach would reduce specification risk. He says this is important because “performance differences due to model specification are not expected to mean revert and are therefore expected to be random but very permanent return artifacts.”
This may be true in the short run. You should not expect poor recent performance to be immediately followed by good performance. (We will ignore the fact that stocks can be short-term mean-reverting.) But neither can you expect more poor performance to follow initial poor performance. Month-by-month returns from momentum investing are generally independent but have positive expected values. Otherwise, you would not do momentum investing.
The crux of Corey’s argument is that all lookbacks are equal, and any differences among them are insignificant statistical noise. So you might as well pool them together and exploit the perceived benefit of diversification. But Corey bases his analysis on looking at only 10 years of past data. The less data you use, the less chance you have of showing statistical significance. For properly determining statistical significance you need much more data. Corey has access to the same longer-term data I do and could have used it for his statistical tests. One has to wonder why he did not do so.
One also needs to wonder why Corey choose a range of lookbacks from 6 to 12 months. He could have chosen a range starting from 3 months which also comes up in momentum studies. Corey’s selection bias further weakens his statistical inferences.
Even if you have plenty of data, it may still be difficult to find statistical significance when comparing Sharpe ratios as Corey does. This is due to their weak adherence to statistical assumptions. If you are going to compare Sharpe ratios, you should at least use robust estimation methods. These often produce wide confidence intervals. Not seeing significance could simply be due to the low power of these kinds of tests.
You should also be looking at independent data sets for this type of analysis. Corey’s seven lookbacks are not independent. They are highly correlated which further invalidates tests of their statistical significance. You could reduce specification error more effectively by using different models or additional selection criteria with low correlations to one another rather than a single model with correlated parameters. This is what we do. We have multiple proprietary models using variations on dual momentum. Within these models, we have additional trade filters, such as breadth, mean reversion, and intermarket validation.
Corey also introduces bias by using an equally allocated range of lookbacks. But the percentage difference between 6 and 7 is greater than the percentage difference between 11 and 12. This means there will be a greater range of results in lower lookback periods that will cause overweighting in their direction.
On a practical front, of the seven lookback periods Corey used, only the 10-month one would have gotten you out of the S&P 500 before the December loss. The 8 and 9-month lookbacks would have kept you in and caused you to miss out on profits in November. The other 3 months would have given the same results as a 12-month lookback. During the last quarter of the year, the 12-month lookback model was down the same amount as the S&P index, 13.6%. With Corey’s 7 lookbacks, you would have been down 12.3%. So there was little difference between using one or seven lookback models. This is due to the high correlation between these lookback periods.
History of the 12-Month Lookback
To better answer the question if a 12-month lookback is desirable, let us look at the evidence. A 12-month look back applied to U.S. stocks was first presented by Cowles & Jones in 1937. They tabulated the performance of all NYSE stocks from 1920 through 1935. After examining the data, they concluded stocks that performed better in the past 12 months also outperformed the following year. The 12-month lookback they identified has held up well in and out of sample going forward and backward in time. Jegadeesh (1990) in “Evidence of Predictable Behavior of Security Returns” showed that the 12-month serial correlation in stocks was particularly strong compared to other months.
Greyserman & Kaminski (2014) showed that long/short absolute momentum with a 12-month lookback beat buy-and-hold back to the beginning of stock trading in the 1600s. It did better in all markets back to the year 1223!
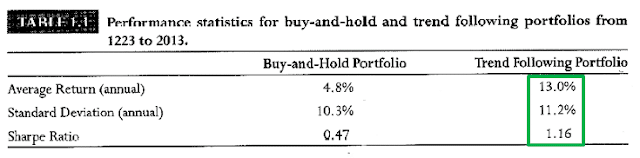
I do not see how anyone can look at these studies and say that momentum with a 12-month lookback is just good luck, as Corey does. You cannot judge the probability of something happening after it has already happened. You have to look at results out-of-sample. A 12-month lookback has plenty of out-of-sample validation since it was first introduced by Cowles and Jones in 1937.
Lookback Period Comparisons
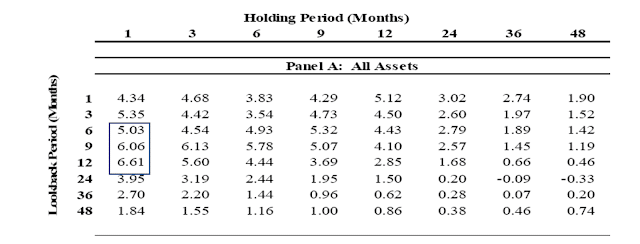
The first rigorous comparison of lookback periods was in Jegadeesh & Titman’s (1993) seminal momentum paper. They compared 3, 6, 9, and 12-month formation (lookback) and holding periods on U.S. stocks from 1965 through 1989.
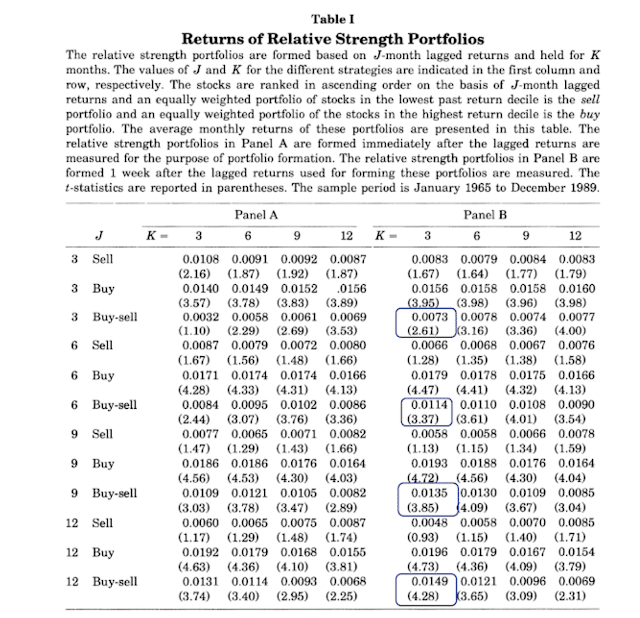
We see an improvement in return and t-stats as we go from a 3 to a 12-month lookback period. Not only does a 12-month lookback show the best performance. The continuity in improvement as we extend the lookback period from 3 to 12 months supports the robustness of the 12-month lookback period.
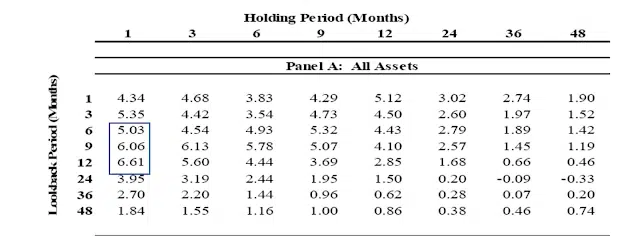
Absolute (time series) momentum applied to multiple markets from 1985 through 2009 also showed a steady improvement in t-stats as the lookback period increased from 6 to 12 months.
Source: Moskowitz, Ooi, and Pedersen (2012), “Time Series Momentum”
GEM Results
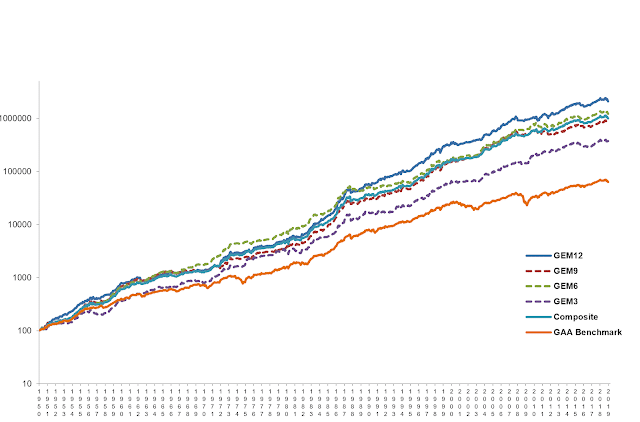
Here are GEM results using 3, 6, 9, and 12-month lookback periods and an equally weighted combination of these periods since 1950. The GAA benchmark is a global asset allocation of 45% S&P 500, 28% MSCI ACWI ex-U.S. or World ex-U.S., and 27% 5-Year Bonds. This represents the amount of time GEM was in each of these markets since 1950. (For more on GEM since 1950, see our blog post “Extended Backtest of Global Equities Momentum.”)
| GEM 12 | GEM 9 | GEM 6 | GEM3 | Composite | GAA | |
| CAGR | 15.5 | 13.9 | 14.6 | 12.7 | 14.3 | 9.8 |
| Standard Deviation | 11.6 | 11.4 | 10.9 | 1.0 | 10.2 | 9.9 |
| Sharpe Ratio | 0.95 | 0.83 | 0.93 | 0.76 | 0.95 | 0.58 |
| Worst Drawdown | -17.8 | -20.7 | -21.6 | -23.3 | -17.7 | -41.2 |
Results are hypothetical, are NOT an indicator of future results, and do NOT represent returns that any investor actually attained. Indexes are unmanaged, do not reflect management or trading fees, and one cannot invest directly in an index. Please see our Disclaimer page for more information.
A relatively slow 12-month lookback comes closest to that old Wall Street adage, “More money is made by sitting than by trading.” Any time you deviate from the market index you are saying you know more than the market. A 12-month lookback keeps one in stocks longer than shorter lookbacks.
The 12-month lookback had a higher return but the same Sharpe ratio and drawdown here as the Composite. Corey also showed a higher return and equal Sharpe ratio from a 12-month lookback compared to a composite of seven lookbacks over the 10-year period he examined.
Why not sacrifice 120 basis points in past annual returns and use the composite, since the Sharpe ratios and drawdowns are the same and short-term volatility is less? There are several reasons some investors may not want to do this.
First is the added complexity of multiple models. GEM was designed for public do-it-yourself investors as something easy to understand and implement. It’s hard to imagine public investors wanting to run seven dual momentum models every month.
Next, there are 35% more trades for the composite of four lookbacks in GEM. Shorter lookbacks may be more susceptible to losses in choppy markets. A 12-month look back with fewer trades is also more tax efficient. With a 12-month lookback, around 70% of GEM trades would have given long-term capital gains. This would change with shorter lookback periods.
An Alternative
Outside diversification can reduce the impact of specification risk without harming the expected value of your investment model. If you want to reduce the short-term volatility of GEM, you could add a modest allocation to stocks, bonds, or other assets. You could also add other strategies.
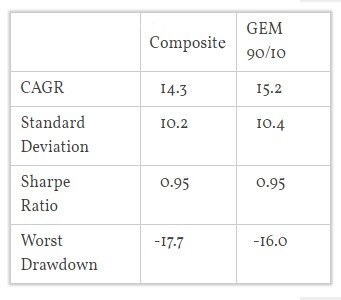
Here is Corey’s composite lookback model compared to simple GEM with a 10% allocation to 5-year bonds. It is in line with Warren Buffett’s investment instructions for his estate: put 90% in an S&P index fund and 10% in short-term bonds.
Results are hypothetical, are NOT an indicator of future results, and do NOT represent returns that any investor actually attained. Indexes are unmanaged, do not reflect management or trading fees, and one cannot invest directly in an index. Please see our Disclaimer page for more information.
Investors could alter the 90/10 ratio to suit their own risk preferences. In my book, I show a 70% allocation to GEM and a 30% allocation to bonds for more conservative investors who want less short-term variability. Allocating to different assets should reduce style and timing risks, as well as specification risk.
Practicality
No one can say with certainty what the future will be. Process diversification can be beneficial if done selectively. Corey is correct in saying specification risk exists, and we can reduce it by using multiple lookback periods. But there may be better ways, such as diversification with other approaches or non-correlated assets, to reduce specification risk as well as other risks.
We incorporate other assets into the proprietary dual momentum models we license to investment advisors and family offices. We also use a modest number of different lookback periods. But we derive more value by using multiple models and by incorporating less correlated selection filters to reduce portfolio volatility and specification risk.
Better Informed Investors
To me, the most interesting idea in Corey’s article was that some investors and advisors overreact to short-term performance. Trend-following models will never sell at the exact top nor buy at the exact bottom. They do not have to for investors to do well. There will always be noise and tracking errors whether you have one or a dozen lookback models. If there were no false signals from time to time, everyone would become a trend follower, and we would no longer have an advantage.
The real fragility is with investors who misperceive the normal volatility you should expect from systematic investing. If you abandon a model whenever it has losing trades, you are not likely to succeed at quantitative investing. Momentum investors need a good understanding of the process and the research supporting it. This can help them keep the big picture in mind and avoid poor timing decisions.