Our first look at calendar influences was in analyzing the best time during the month to execute dual momentum trades. Studies here, here, and here show that stocks perform best early in the month. This is when institutional investors make changes to their portfolios. Prices then are most representative of their true value.
Different variations of dual momentum or trend following show similar results. Rebalancing during the first two trading days of the month gives better results than rebalancing on other days of the month or on a weekly basis.
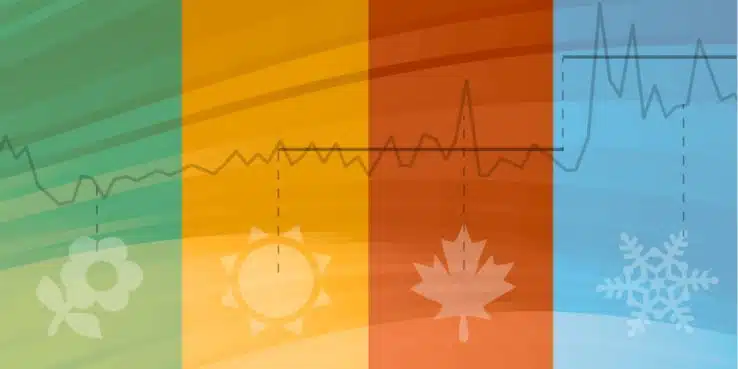
Seasonal Effects
There are other ways to use the calendar. Keloharju, Linnainmaa, and Nyberg (2015) showed similar calendar month returns in stocks and other assets. Xu and McConnell (2l06) described the turn-of-the-month effect in equity returns. Swinkels and van Vliet (2010) further documented this as well as the Halloween effect.
Every year since 1967, Yale Hirsch published results of the “Sell in May and Go Away” system in his Stock Trader’s Almanac. This became known as the Halloween effect since you invest in the stock market on October 31 each year and stay out of the market from May until then.
Hirsch was not the first to acknowledge the effectiveness of this approach. According to Jacobsen & Zhang (2018), the Financial Times of London published “Sell in May and Go Away” in May 1935. Jacobsen & Zhang showed positive out-of-sample results from the Halloween effect in all 37 countries that they examined earlier in Bouman & Jacobsen (2002).
The Halloween effect versus buy-and-hold was documented in 114 stock market indices beginning with the U.K. in 1693.
Andrade, Chhaochhia, & Fuerst (2012) also showed out-of-sample validation of the Bouman & Jacobsen (2002) results.
Plastun et al. (2019) did a rigorous statistical analysis of the Halloween effect in the U.S. They found it has been more persistent since the middle of the 20th century.
The Halloween effect does not apply just to stocks. In this blog post, Alpha Architect showed that seasonality has been effective in 12 of 13 different asset indices with a time horizon of up to 87 years.
Seasonality is similar to momentum in that it is persistent, pervasive, and not always recognized. It would be interesting to see the effect of seasonality in factor regression models. You could do this by using dummy variables to represent risk-on and risk-off seasonality.
Why It Works
There are several reasons why the Halloween indicator works well. First are seasonal patterns of production and consumption. During summer vacation months there is less economic activity, less trading activity, and less liquidity. In winter there is more consumer demand fueled by the holiday season.
There is another explanation known as Seasonal Affective Disorder (SAD). This links seasonal risk aversion to mood swings related to changing weather patterns. Hirshleifer, Jiang, and Meng (2019) document stock market SAD sensitivity to investor moods.
The best explanation of the Halloween effect may be what Doeswijk (2005) calls the Optimism Cycle. Near year-end investors look toward the new year with optimistic expectations. This results in attractive returns for stocks. Several months into the year this initial optimism is hard to maintain and is followed by renewed realism. The stock market then experiences a summer lull. The Optimism Cycle hypothesis reflects a constant risk premium but a varying perception of the economic outlook. Since this phenomenon is based on an aspect of human psychology, it tricks investors into repeating the same bias year after year.
In 2015, I wondered if it would make sense to incorporate the Halloween effect into our momentum investment models. In this blog post, I showed why that is not a good idea. There are still stock market profits to be had during the summer. Sometimes it is better to avoid the stock market during winter months. The absolute momentum part of dual momentum has done a better job capturing the market’s upside while giving downside protection during bear markets.
Seasonal Sector Rotation
Doeswijk (2005) also showed one could use seasonality to shift between defensive market sectors in the summer and cyclical market sectors in the winter. This may be an attractive alternative to exiting and entering the stock market then.
Jacobsen & Visaltanachoti (2006) looked at seasonal sector rotation over a longer period from 1926 through 2005. They noted that seasonal sector rotation has been stronger since 1990 than from 1926 to 1990.
In 2013, the Leuthold Group showed good results switching seasonally between the cyclical and defensive S&P sectors.
In July 2018, Sam Stovall, chief equities analyst with Standard & Poor’s, created the CFRA- Stovall Equal Weight Seasonal Rotation Total Return Index. From May through October, Stovall’s index positions defensively by investing in the S&P consumer staples and health care sectors. From November through April, his index invests in the industrials, information technology, materials, and consumer discretionary sectors.
Here is additional information by Stovall on his approach.
Our Results
Most sector analysis extends back to late 1989. This was when the S&P sector data began. But we have data from Thompson Reuters that extends the S&P sectors back to January 1973. Here are the sector annual returns above or below the S&P 500 index during cyclical and defensive periods from January 1973 to July 2020.
| Nov-Apr | May-Oct | |
| Energy | 2.72 | -0.28 |
| Financial | -0.09 | 1.61 |
| Materials | 5.70 | -6.85 |
| Industrials | 3.21 | -2.77 |
| Discretionary | 4.27 | -4.23 |
| Staples | -2.63 | 4.97 |
| Healthcare | -1.39 | 4.92 |
| Utilities | -5.59 | 5.16 |
| Technology | 2.00 | 0.42 |
Results are hypothetical, are NOT an indicator of future results, and do NOT represent returns that any investor actually attained. Indexes are unmanaged, do not reflect management or trading fees, and one cannot invest directly in an index. Please see our Disclaimer page for additional disclosures.
We see that Leuthold’s choice of sectors has held up over an extended period of time and is more accurate than Stovall’s sectors.
Applying Seasonal Rotation
Now we will compare S&P 500 returns to those of a seasonal sector rotation strategy that switches between defensive and cyclical sectors every six months. Tracking error between this approach and the S&P 500 can sometimes be considerable since the switching strategy is in only 3 of the11 S&P sectors. So we also show results from allocating 50% to the S&P 500 and 50% to our seasonal rotation strategy. This approach reduces tracking error and provides some diversification.
| S&P 500 | S&P Seasonal | Average | |
| CAGR | 10.6 | 15.2 | 12.8 |
| Std Deviation | 15.3 | 15.9 | 14.9 |
| Sharpe Ratio | 0.41 | 0.68 | 0.57 |
| Max Drawdown | -50.9 | -47.0 | -46.6 |
Results are hypothetical, are NOT an indicator of future results, and do NOT represent returns that any investor actually attained. Indexes are unmanaged, do not reflect management or trading fees, and one cannot invest directly in an index. Please see our Disclaimer page for additional disclosures.
The average of the two approaches boosts the annual return of the S&P 500 by 220 basis points. It also gives lower volatility and less of a maximum drawdown than each approach. This is because the 0.87 monthly correlation between the two approaches is not that high. By allocating equally to each approach, we can turn tracking error into a diversification benefit.
Now let us look at the S&P 500 with a trend filter. We will invest in the S&P 500 when its trend is positive according to absolute momentum with a commonly-used 12-month lookback. When we are not invested in the S&P 500, we hold the Bloomberg Barclays U.S. Aggregate Bond index. We compare this trend following approach to the seasonal rotation strategy and to a 50/50 blend of both approaches.
| S&P Abs Mom | S&P Seasonal | Average | |
| CAGR | 11.9 | 15.2 | 13.8 |
| Std Deviation | 12.1 | 15.9 | 12.5 |
| Sharpe Ratio | 0.60 | 0.68 | 0.72 |
| Max Drawdown | -29.6 | -47.0 | -28.1 |
Results are hypothetical, are NOT an indicator of future results, and do NOT represent returns that any investor actually attained. Indexes are unmanaged, do not reflect management or trading fees, and one cannot invest directly in an index. Please see our Disclaimer page for additional disclosures.
Adding rotational seasonality boosts the trend-filtered annual return of the S&P 500 by 190 basis points with just a small increase in volatility. Sharp ratio and maximum drawdown are no worse than with either strategy. Seasonal sector rotation adds value even when we use a trend filter.
Finally, let us see what happens when we add seasonal sector rotation to our dual momentum GEM model. Below are the results with and without seasonal sector rotation when our GEM model invests in the S&P 500. We also see what happens when we average regular GEM with GEM using seasonal sectors.
| GEM | GEM Seasonal | Average | |
| CAGR | 15.1 | 16.7 | 15.9 |
| Std Deviation | 12.4 | 12.4 | 12.1 |
| Sharpe Ratio | 0.82 | 0.93 | 0.90 |
| Max Drawdown | -19.6 | -26.0 | -22.8 |
Results are hypothetical, are NOT an indicator of future results, and do NOT represent returns that any investor actually attained. Indexes are unmanaged, do not reflect management or trading fees, and one cannot invest directly in an index. Please see our Disclaimer page for additional disclosures.
Here we see a more modest boost in performance. The average of seasonal sector GEM and regular GEM adds an extra 90 basis points annually to GEM’s return. A combined approach may be attractive to GEM investors who don’t mind some additional tracking error.
We pointed out in our last blog post that adding uncorrelated assets or other trading strategies to a model is a better way to deal with model uncertainties than adding many correlated lookback periods. We see that demonstrated here by getting an attractive boost in return when we add a calendar-based approach.
Looking at the above data and graphs, we also see that the value from adding seasonal sector rotation decreases as the underlying investment approach gets stronger. Seasonality adds the most incremental return with passive investing in the S&P 500 index. Seasonality adds less value when it is applied to the S&P 500 with a trend filter. It adds the least amount of value to our higher-return GEM model.
Last year I looked at adding seasonality to the proprietary dual momentum models we license to advisors and family offices. These models are already well-diversified with additional assets and trading approach variations. Because the models are already so strong, seasonality does not improve them at all. See our Proprietary Models page, or contact us for more information about our proprietary models.