In my last blog post, “A Sensible Approach to Bitcoin”, I reviewed the pros and cons of bitcoin. For reasons given in that article, I regard bitcoin as a high risk, high potential reward trading vehicle rather than as a permanent investment. Academic research here and here supports trading bitcoin based on its strong price momentum.
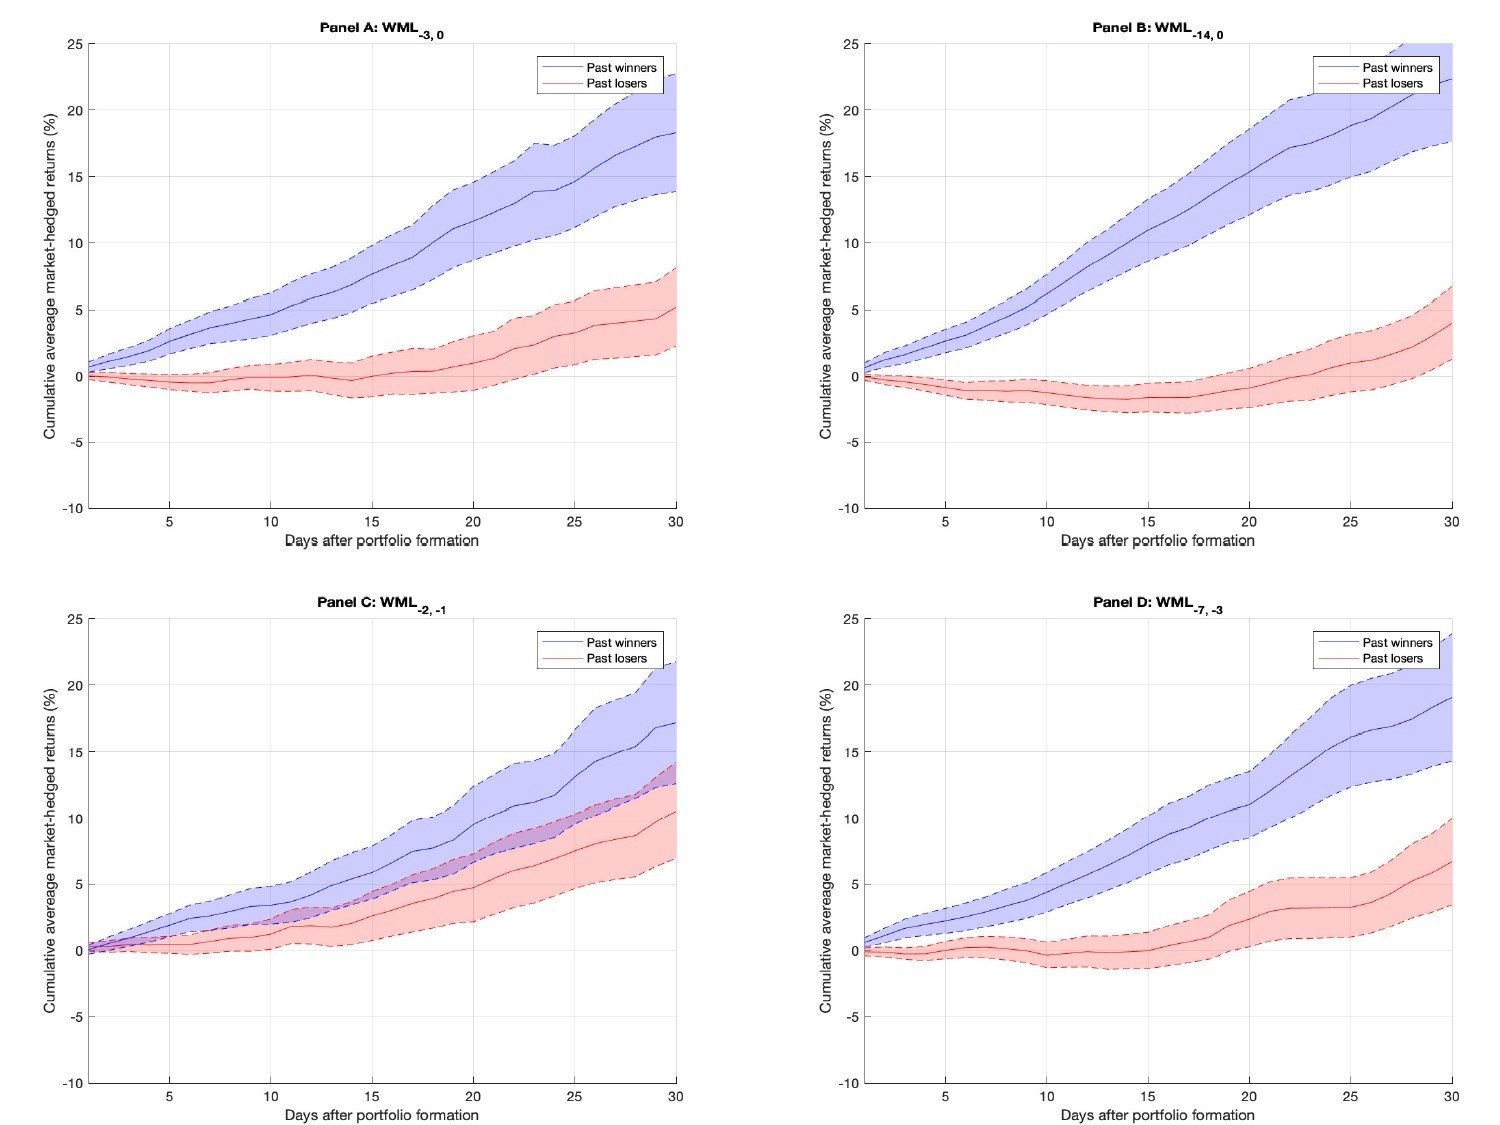
Source: Yang (2019), “Behavioral Anomalies in Cryptocurrency Markets”
Bitcoin’s price movement can largely be explained by the behavioral forces of fear and greed. As with all momentum, this often manifests as herding or the bandwagon effect. Fear of missing out (FOMO) is part of that.
Bitcoin’s usable price history goes back only ten years. So, I looked for a trend-following model that has a long history of working well in other markets. I found one that has been successful for more than 50 years. I showed the performance through April of that model in my earlier report. Here are the updated results:
| Bitcoin Upward Bound Long Entries (BUBLE) | ||||
| Buy Date | Buy Price | Sell Date | Sell Price | % Return |
| 12/20/11 | 4.75 | 01/31/12 | 5.70 | 20.0 |
| 03/14/12 | 5.44 | 03/20/12 | 4.82 | -11.4 |
| 04/20/12 | 5.15 | 10/22/12 | 11.54 | 124.1 |
| 11/17/12 | 11.48 | 06/09/13 | 109.11 | 850.4 |
| 07/31/13 | 96.98 | 12/17/13 | 690.50 | 612.0 |
| 01/05/14 | 828.79 | 02/10/14 | 713.00 | -14.0 |
| 04/16/14 | 523.10 | 04/28/14 | 430.00 | -17.8 |
| 05/22/14 | 494.00 | 06/14/14 | 592.00 | 19.8 |
| 07/01/14 | 640.00 | 07/26/14 | 602.93 | -5.8 |
| 11/12/14 | 370.09 | 12/11/14 | 345.22 | -6.7 |
| 02/15/15 | 256.81 | 03/19/15 | 256.59 | -0.1 |
| 05/09/15 | 243.22 | 06/01/15 | 228.91 | -5.9 |
| 06/16/15 | 236.00 | 08/13/15 | 267.53 | 13.4 |
| 09/29/15 | 239.14 | 01/16/16 | 360.62 | 50.8 |
| 02/15/16 | 405.50 | 05/22/16 | 442.72 | 9.2 |
| 05/28/16 | 470.58 | 08/01/16 | 622.50 | 32.3 |
| 09/04/16 | 596.25 | 01/12/17 | 778.70 | 30.6 |
| 02/01/17 | 964.00 | 03/18/17 | 1068.16 | 10.8 |
| 04/04/17 | 1146.42 | 07/11/17 | 2323.45 | 102.7 |
| 07/31/17 | 2745.76 | 09/14/17 | 3861.89 | 40.6 |
| 10/01/17 | 4326.09 | 01/17/18 | 11394.00 | 163.4 |
| 02/18/18 | 11101.00 | 03/09/18 | 9293.06 | -16.3 |
| 04/16/18 | 8353.43 | 05/12/18 | 8408.79 | 0.7 |
| 07/18/18 | 7310.71 | 08/05/18 | 7010.00 | -4.1 |
| 09/01/18 | 7015.78 | 09/08/18 | 6401.00 | -8.8 |
| 12/24/18 | 3947.82 | 01/20/19 | 3680.00 | -6.8 |
| 02/17/19 | 3580.43 | 07/17/19 | 9427.45 | 163.3 |
| 08/05/19 | 10986.55 | 08/15/19 | 10022.50 | -8.8 |
| 10/26/19 | 8677.09 | 11/11/19 | 8499.53 | -2.0 |
| 01/07/20 | 7768.17 | 02/27/20 | 8778.37 | 13.0 |
| 04/07/20 | 7335.85 | 09/04/20 | 10160.00 | 38.5 |
| 10/10/20 | 11060.46 | 04/22/21 | 53823.48 | 386.6 |
| 07/26/21 | 35438.93 | 09/13/21 | 46039.42 | 29.9 |
| 10/03/21 | 47644.63 | 10/20/21* | 65990.30 | 38.5 |
| * open trade | ||||
| Average Return | 73.3% | |||
| Win Percent | 61.1% | |||
Digital assets are highly volatile and have substantial risks. Past results are no guarantee of future success. Please see the Disclaimer at end of this article for more information.
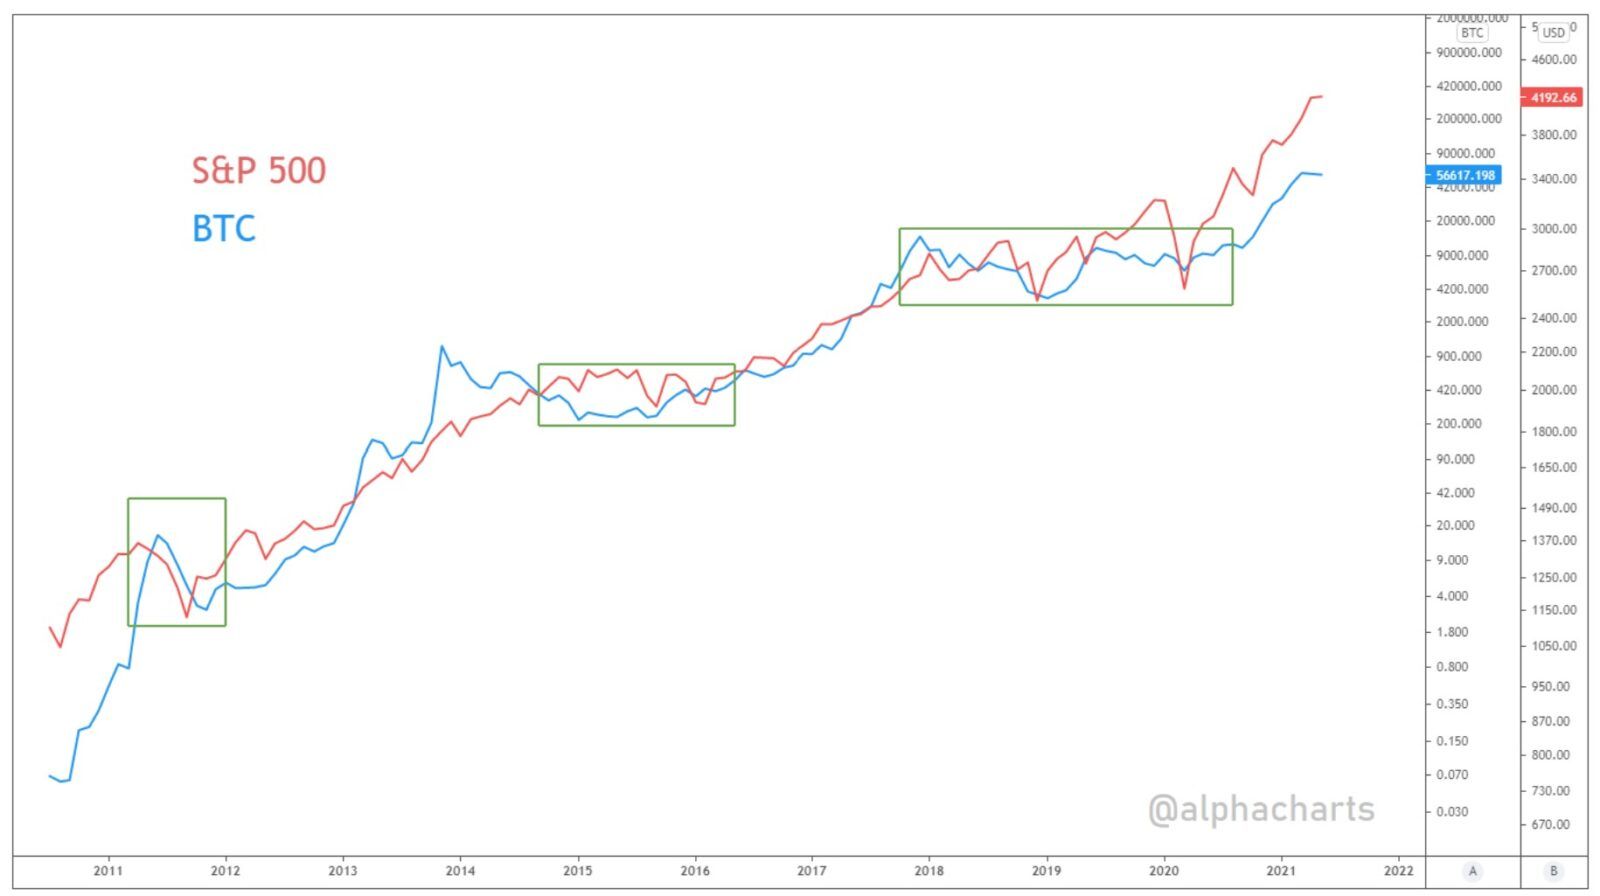
Bitcoin is a risk-on asset that responds to many of the same factors as the stock market.
Robustness
I use the same model with Ethereum.
| Ethereum Long Entries (ETHLE) | ||||
| Buy Date | Buy Price | Sell Date | Sell Price | % Return |
| 10/27/15 | 0.75 | 04/09/16 | 9.77 | 1202.7 |
| 05/12/16 | 9.98 | 07/05/16 | 11.44 | 14.6 |
| 07/23/16 | 14.77 | 08/02/16 | 11.03 | -25.3 |
| 09/11/16 | 12.15 | 10/09/16 | 12.20 | 0.4 |
| 01/04/17 | 9.78 | 06/27/17 | 273.65 | 2698.1 |
| 08/06/17 | 252.84 | 09/14/17 | 275.79 | 9.1 |
| 10/16/17 | 335.26 | 02/05/18 | 825.13 | 146.1 |
| 04/16/18 | 533.86 | 05/24/18 | 578.40 | 8.3 |
| 11/08/18 | 216.40 | 11/19/18 | 175.95 | -18.7 |
| 12/21/18 | 114.47 | 01/21/19 | 117.46 | 2.6 |
| 02/13/19 | 120.74 | 07/16/19 | 228.29 | 89.1 |
| 09/17/19 | 197.75 | 09/26/19 | 169.84 | -14.1 |
| 01/07/20 | 144.39 | 03/09/20 | 199.83 | 38.4 |
| 04/07/20 | 171.50 | 05/23/21 | 2291.91 | 1236.4 |
| 07/28/21 | 2299.76 | 09/21/21 | 2972.88 | 29.3 |
| 10/07/21 | 3575.89 | 10/20/21* | 4163.60 | 16.4 |
| *open trade | ||||
| Average Return | 339.6% | |||
| Win Percent | 81.3% | |||
Digital assets are highly volatile and have substantial risks. Past results are no guarantee of future success. Please see the Disclaimer at end of this article for more information.
Ethereum has more uses than bitcoin as seen here. Ethereum is also transitioning to proof-of-stake from proof-of-work transactions. Proof-of-stake is not energy-intensive and does not have the same environmental impact as proof-of-work, which bitcoin uses.
The same model works well longer-term with gold. I also use this trend-following approach with my High Yield Municipal Model (HYMM) for managing cash reserves when BUBLE and ETHLE are on the sidelines.
Implementation
Interactive Brokers (IBKR) recently made low-cost crypto trading available to its clients. IBKR’s crypto partner, Paxos, uses liquidity providers for better trade executions. This is also what institutional trading desks do.
Investors can take comfort from having their crypto trades held safely at a major brokerage firm. Millions of dollars are stolen by hackers each year from crypto exchanges. Brokerage firm investors are better protected from this.
When I traded cryptos on exchanges, my biggest concern was how my heirs would be able to cash out my positions. Brokerage firms make this an easy process. Webull, TradeStation, and Robinhood are other retail brokers that provide spot crypto trading.
Many would like to own bitcoin through an ETF for ease of investing and tax advantages. Before now, U.S. investors could only buy Canadian bitcoin ETFs or U.S.-based investment trusts.
ETFs always trade at or near their NAVs, while investment trusts, like GBTC, trade at fluctuating premiums or discounts to their NAV. ETFs, in general, also have greater liquidity and lower expense ratios.
Bitcoin Futures-Based ETFs
The SEC has now approved three bitcoin ETFs. They are the ProShares Bitcoin Strategy ETF (BITO), Valkyrie Bitcoin Strategy ETF (BTF), and VanEck Bitcoin Strategy ETF (XBTF).
BITO began trading on October 19. In its first two days of trading, BITO set an all-time record by taking in over $1 billion of assets. BITO and BTF have a 0.95% annual expense ratio, while XBTF will charge 0.65%.
All three funds hold bitcoin futures contracts rather than spot bitcoin. Galaxy, AdvisorShares, Bitwise, BlockFi, and ARK have also filed registration applications for futures-based bitcoin ETFs.
The SEC chose futures-based ETFs for initial approval because futures is a regulated market. It provides greater customer protection and less chance of market manipulation than the spot market. ETFs using futures come under the Investment Act of 1940. It gives greater investor protection than the Investment Act of 1933 that applies to other markets.
As a Section 1256 asset, taxable gains and losses from bitcoin futures are 60% long-term and 40% short-term regardless of their holding period. Unrealized gains at year-end are also taxable. For non-retirement active accounts, the 60/40 tax treatment should be a plus. For long-term, buy-and-hold HODLers, year-end mark-to-market may be a minus. Those investors might do better buying bitcoin through an exchange or brokerage firm, or by HODLing Canadian spot bitcoin ETFs. (There are no U.S,-based Ethereum ETFs, but U.S. investors can buy Canadian ones or spot Ethereum through a broker or exchange.)
Futures-based ETFs are also subject to contango bleed and contract rollover costs. Contango is the premium in contracts based on expected higher prices when the contracts expire. The futures-based Bitcoin Strategy ProFund (BTCFX) mutual fund was launched last June. Its performance has lagged behind a theoretical spot bitcoin position by 0.6% because of these costs.
With expected increases in bitcoin futures volume, some analysts are expecting roll costs to be 5-10% per year. The annualized roll yield is currently around 10%. If contango remains high, there will be arbitrage opportunities for buying spot bitcoin and shorting the futures. This should reduce contango costs.
Position limits may also become an issue for futures-based ETFs unless the limits are raised or they are allowed to use swaps. Otherwise, once these ETFs approach position limits, they will need to invest some of their assets in bitcoin-related companies rather than bitcoin futures.
There are other risks of futures-based bitcoin ETFs that investors should know about. You can find out about them in the fund prospectuses. As the SEC says, “Before investing in a fund that holds bitcoin futures contracts, make sure you carefully weigh the potential risks and benefits.”
DISCLAIMER
The future performance of this model may differ significantly from historical performance. Hypothetical performance results are presented for illustrative purposes only and should not be interpreted as a sign of future performance or as investment advice.
Hypothetical performance results (e.g., quantitative backtests) have many inherent limitations, some of which, but not all, are described herein. One of the limitations of hypothetical performance results is that they are generally prepared with the benefit of hindsight. In addition, hypothetical trading does not involve financial risk, and no hypothetical trading record can completely account for the impact of financial risk in actual trading. For example, the ability to withstand losses or adhere to a particular trading program in spite of trading losses can adversely affect actual trading results.
The hypothetical performance results contained herein represent the application of the quantitative model as currently in effect, and there can be no assurance that the model will remain the same in the future or that an application of the current models in the future will produce similar results because the relevant market and economic conditions that prevailed during the hypothetical performance period will not recur.
There are many other risk factors related to the markets in general and to the implementation of any specific trading program which cannot be fully accounted for in the preparation of hypothetical performance results, all of which can adversely affect actual trading results.