by Matthew Richardson, JD, Ph.D.
As the surge of boomer retirements continues, commentators have given new thought to what safe withdrawal rates are for retirement accounts. The topic is especially significant given two additional factors. First, retirement balances are shockingly low for boomers (Ghilarducci 2015)[1]. Second, market fundamentals do not suggest that either bonds or equities will generate reliably strong rates of return over the next 10-15 years on a buy-and-hold basis (Research Affiliates 2018)[2]. But momentum portfolios as set forth in Gary Antonacci’s book Dual Momentum (2014) may provide a constructive solution to these problems.
Historically, a simple 4% rate has been perceived as a safe withdrawal rate (SWR) for retirement accounts. This includes adjustments for inflation while assuming thirty years of retirement under various portfolio allocations of stocks and bonds managed on a buy-and-hold basis (Bengen 1994)[3]. More recently, however, commentators have questioned whether a 4% withdrawal rate is too risky under current and foreseeable market conditions (Miller 2017)[4]. Overvalued equities and lower expected returns on bonds in a rising interest rate environment are the chief concerns.
But the vast majority of SWR studies are based on various allocations of buy-and-hold portfolios of stocks and bonds. Researchers have only recently begun to consider how the SWR calculus could be affected by factor-based investment styles like value or momentum (Kitces 2016[5]; Miller 2017[6]).
As for momentum, Andrew Miller has suggested that including a 10% allocation to a managed futures investment strategy, based on trend following or absolute momentum principles, could increase the withdrawal rate for those contemplating retirement. Besides functioning as a diversifier to buy-and-hold portfolios of stocks and bonds, managed futures can come to the rescue in times when stocks and bonds both underperform, thus generating “crisis alpha” (Miller 2016).
Miller’s suggestion of using trend-following as a means of increasing SWRs is worth a closer look. If a 10% allocation to an absolute momentum system can boost SWRs in an otherwise buy-and-hold portfolio of stocks and bonds, what could the SWR be if a greater allocation to a momentum system were utilized?
Several British researchers (Clare, et al. 2016) in “Sequencing, Perfect Withdrawal Rates and Trend Following Investing Strategies: Making the Known Unknown Less Unknown” sought to determine a “perfect withdrawal rate” (PWR) for a portfolio using different investment strategies over a 20-year time frame, including buy-and-hold, valuation-based, and trend-following strategies. According to the authors, the PWR would be the correct withdrawal rate for investors who had perfect knowledge about how their investments would perform over the ensuing 20 years.
The authors’ trend-following strategy was tested on monthly S&P500 data from 1872 to 2014 rebalanced monthly, depending on whether the price of the index exceeded the 10-month moving average of the current price on the rebalance date. Because the portfolio consisted of one asset, the authors’ strategy was a pure trend-following approach lacking any element of relative strength momentum.
The annualized real return of their strategy was 8.84%, more than 2% greater than the index itself during this time frame, and with substantially lower volatility (9.86% versus 14.29%) and drawdowns (34.88% versus 76.80%), all characteristic of trend-following strategies. The trend-following strategy largely avoided one form of “sequencing risk,” or the risk of a sharp decline in the value of the portfolio early in the distribution phase, even when distributions began in the midst of a bear market.
By utilizing this data set with 20,000 Monte Carlo simulations, the minimum PWR, specifically that in the 5th percentile or less, was from 5.57% to 6.61% real, while the index itself could only provide a PWR of only 2.95% to 4.2%. The authors concluded that a simple trend-following system “dampens volatility, typically maintains or increases returns over longer periods, and substantially reduces the maximum drawdown for that series.”
Similar results hold true when SWRs are calculated from extensive performance data included in Gary Antonacci’s Global Equities Momentum (GEM), a monthly dual momentum system that includes both relative strength and absolute momentum applied to indices of U.S. stocks, non-U.S. stocks, and U.S. aggregate bonds. In Dual Momentum, Antonacci’s GEM data covers 1974 and 2013, a period that includes part of one severe bear market with high inflation (1973-74) and two full bear markets (2000-2002; and 2007-2009). Even more extensive GEM data is provided on Antonacci’s website, from 1971 to the present (2018)[7].
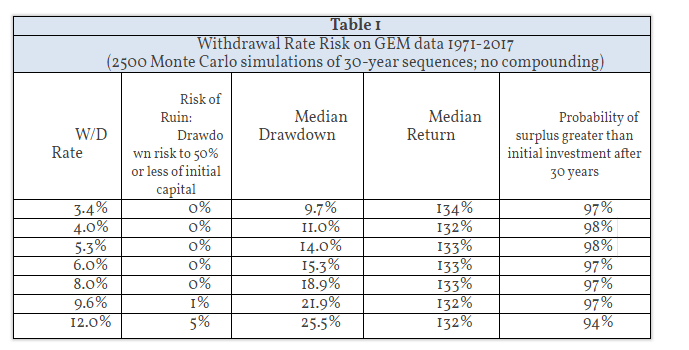
Notably, the annualized returns from 1974 to 2013 exceeded 17% with a maximum drawdown of just under 18% with only four losing years and no worse year than an 8.2% annual loss. With such a favorable risk-reward profile, Antonacci’s GEM system can comfortably sustain higher safe withdrawal rates on 2500 Monte Carlo runs of 30-year periods (Table 1). Note that Monte Carlo analysis is particularly useful for retirement withdrawal strategies because it directly accounts for sequencing risk by repeatedly changing the order of returns.
Results are hypothetical, are NOT an indicator of future results, and do NOT represent returns that any investor actually attained. Indexes are unmanaged, do not reflect management or trading fees, and one cannot invest directly in an index.
Under every withdrawal rate scenario tested, from 3.4% to 12%, the median portfolio managed to more than double the initial investment after 30 years despite withdrawals of various sizes. Further, as a “risk of ruin” measure, only when the withdrawal rate approached or exceeded 10% did any risk at all appear that the account balance would dip below half of the original amount invested at any time within the 30 years.
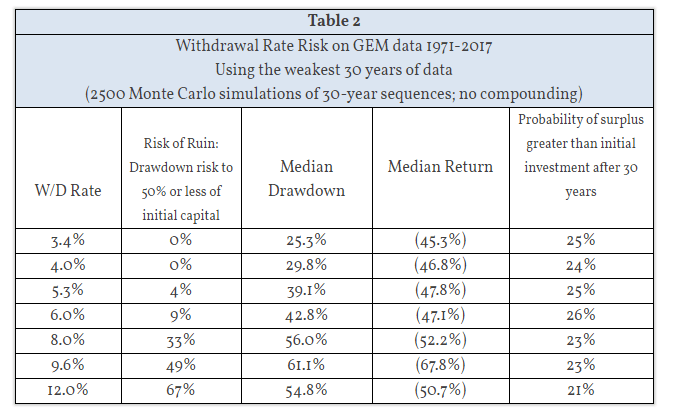
Of course, one counter-argument to using Antonacci’s GEM data, and one that would apply to using any historical market data at all, is that the markets will not necessarily be as favorable to trend-following strategies in the future as they have been over the GEM data time frame. Leaving aside the possibility that future markets may even be kinder to trend-following strategies than they have been—also a possibility—it may be worthwhile to consider what SWRs could be for weaker retirement scenarios using GEM data (Table 2).
Results are hypothetical, are NOT an indicator of future results, and do NOT represent returns that any investor actually attained. Indexes are unmanaged, do not reflect management or trading fees, and one cannot invest directly in an index
The data included in this analysis consists of only the weakest 30 years in the 1971-2017 GEM data set, eliminating the two best years of the 1970s since 1971 (1972 and 1976), all but three years of returns from the bullish 1980s (1982-1987; and 1989), the entirety of the period from the bull market of 1995-1998, the two best years of the 2000s (2003 and 2006), and the best year of the 2010s (2013). At the same time, this data set contains data from all bear markets during the period from 1971 to 2017, including 1973-1974, 2000-2002, and 2007-2009.
Despite these adjustments, the nominal compound annual growth rate of this data set remains 9.24%, slightly more than half of the annualized rate of return of the full GEM data set. At the same time, volatility is reduced from 12.6% to 8.3%. Otherwise, the maximum drawdown increases slightly from 17.8% to 18.9%.
Even with substantially weaker performance data, a withdrawal rate of 5-6% is relatively safe, again because of the reduced volatility and drawdowns that trend-following provides. Under these circumstances, a 5-6% withdrawal rate carries with it the following: a greater than 90% chance that the bottom half of the initial capital invested is never breached, a median loss of less than half of the original balance after 30 years of withdrawals, and a one-in-four chance that the portfolio is larger after 30 years than from when withdrawals began.
For these reasons, it is not surprising that those who study SWRs when applied to buy-and-hold portfolios of stocks and bonds would term a 5% withdrawal rate as “risky” and a 6% or greater withdrawal rate as “gambling” (Bengen 1994). But investment strategy matters, and buy-and-hold is not the only option. Momentum and trend-following approaches create conditions necessary for higher SWRs. These include expected comparable or higher annualized returns, lower volatility, and substantially lower drawdowns. Even under far less than optimal conditions, a likely larger SWR rate continues to apply to a momentum or trend-following investment strategy than the 3-4% rate suggested for buy-and-hold strategies.
For those recent and prospective retirees with lower account balances, utilizing a dual momentum strategy like Antonacci’s GEM system, instead of buy-and-hold, could make all the difference. This could be especially true in the current market environment which includes the prospect of lower returns on buy-and-hold portfolios. Many investors could benefit from incorporating some element of momentum strategies into managing their retirement accounts, whether to accomplish a higher withdrawal rate or simply to reap the well-established benefits of momentum and trend following for other purposes.
Matt Richardson is the Director of Litigation at the law firm of Manley Deas Kochalski LLC based in Columbus, Ohio. He is also the owner of Stillpoint Capital, a registered investment advisor using Antonacci’s proprietary models: https://stillpointinvesting.com
[3] http://www.retailinvestor.org/pdf/Bengen1.pdf
[4] https://alphaarchitect.com/2017/11/08/trend-following-managed-futures-safe-withdrawal-rates/
[6] https://alphaarchitect.com/2017/11/08/trend-following-managed-futures-safe-withdrawal-rates/
[7] https://www.optimalmomentum.com/global-equities-momentum


