
Even with top performing mutual funds, investors can be their own worst enemies and find ways to underperform. Fidelity’s Magellan had an average annual return of 29% and was the best-performing mutual fund from 1977 to 1990. During that same period, the average investor in that fund lost 9% according to Fidelity.
Ken Heebner’s CGM Focus was the best-performing U.S. stock fund for the 10 years ending in 2008. Its average annual return was 25%, but its typical investor lost 11%.
It’s not that hard to understand why investors in these funds did so poorly. Investors are myopic and overly influenced by short-term performance. They are motivated by FUD (fear, uncertainty, and doubt) and FOMO (fear of missing out), which causes them to buy high and sell low. This is the opposite of what they should be doing. Warren Buffett said, “Be fearful when others are greedy and greedy when others are fearful.”
Every investment approach will sometimes show some weakness or consolidation. Over my investment career that began in 1974, I have seen many investors lose patience and move on to less worthwhile investments.
What Fools These Mortals Be
An example was when an investor using my models dropped them to invest in REITs because his wife had been doing well with them. After he made the change, REITs collapsed.
Advisors are not immune to the same biases. I had an advisor licensee who invested based chiefly on one year of real-time performance. My models did very well in 2017, and he started using them in 2018.

In early 2020, he also used a model that got lucky and did well with high-yield bonds. The advisor shifted most of the accounts using my models to this other approach. It lost 35% over the next year, and all the investors closed their accounts.
Seeing this consistent behavioral pattern has led to my very best timing indicator. It has worked dozens of times over the past 50 years with no losses yet. Here it is.
When investors stop using my models and move on to something else, I increase the size of my investment in my models. Performance has always been very good soon after this.
You can use the same strategy yourself. When you start to get impatient with your investment and feel the urge to move on to something else, stay the course and see what happens.
This assumes you have a worthwhile strategy to begin with. That brings us to the second mistake investors make. Many are attracted to short-term real-time performance. Luck can play a significant role in that. Such investors often haven’t examined their investment approach closely enough to have confidence in it during setbacks and consolidations.
That is why I provide links to the academic research underlying all my models. I only use approaches that have at least 100 years of research validation. They must also have logical reasons why they have worked well. Many of the trading models you see elesewhere come from snooping and overfitting limited amounts of data.
I increase the odds of future success by keeping the models simple, so they conform closely to their academic basis. I also check for consistency over time and across different markets.
Even well-researched studies can have selection and data snooping biases since the same data is often used for both inference and model selection. So, I also look for practitioner real-time success with the models.
Investor Myopia
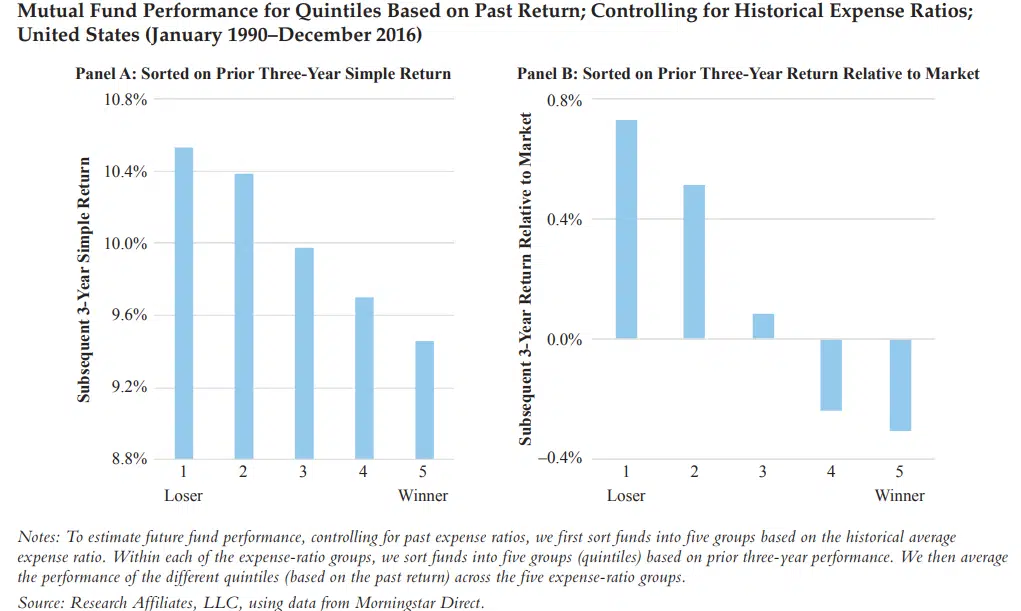
Unfortunately, not everyone pays attention to the research, or they may lose sight of it over time. Instead, they focus on short-term performance. As you can see here, even three years of real-time performance is unreliable. Mutual funds that performed the worst over the past three years did better going forward than those that performed the best. There are similar results from another study:
Individual stocks also show mean reversion over three years, as seen here.
Systematic Approaches
Here are some systematic approaches that have over 100 years of academic validation and long-term, real-time success:
- Absolute momentum (rate of change) – here, here, here, and here
- Simple moving averages – here and here
- Exponential moving averages – here
- Channel breakouts – here and here
- Charting patterns – here
- Dow theory – here and here
- Relative strength – here, here, here, and here
- Seasonality – here and here
- Mean reversion – here, here, and here
After you study this information, you should be convinced that trend following and other systematic approaches, like seasonality and mean reversion, offer the potential for higher returns with less risk than buy-and-hold investing.
You will also see that you can apply rules-based investing to many assets differently. Combining trend-following with non-correlated approaches like seasonality and mean reversion can be especially worthwhile from a portfolio point of view.
Another benefit of systematic rules-based approaches is that they can keep you from being swayed by your emotions. Unfortunately, not everyone who uses such models strictly follows them. That is another reason why you need to study the research. It should increase your confidence in the models and make you more willing to follow their signals. I invest 98% of my liquid assets using my models and strictly follow their signals.
Portfolio Choices
Most investors do not appreciate the advantages of universal trend following. They also do not react well when their portfolios are down 50% or more. So, they try to mitigate downside risk exposure through “strategic asset allocation”. This involves holding both stocks and bonds. It may also include minor allocations to assets like foreign stocks, commodities, managed futures, REITs, or cryptocurrencies. The 60% stocks and 40% bonds allocation is a popular example of strategic asset allocation.
But most other assets have a smaller expected return than U.S. stocks. Investors using bonds and other alternatives sacrifice terminal wealth for a minor reduction in portfolio volatility.
Over the past 35 years, the correlation between stocks and bonds has been positive as much as it has been negative. Recently, the correlation has been more positive than ever. Positive correlation means less risk reduction through diversification. This can be especially problematic during crises.
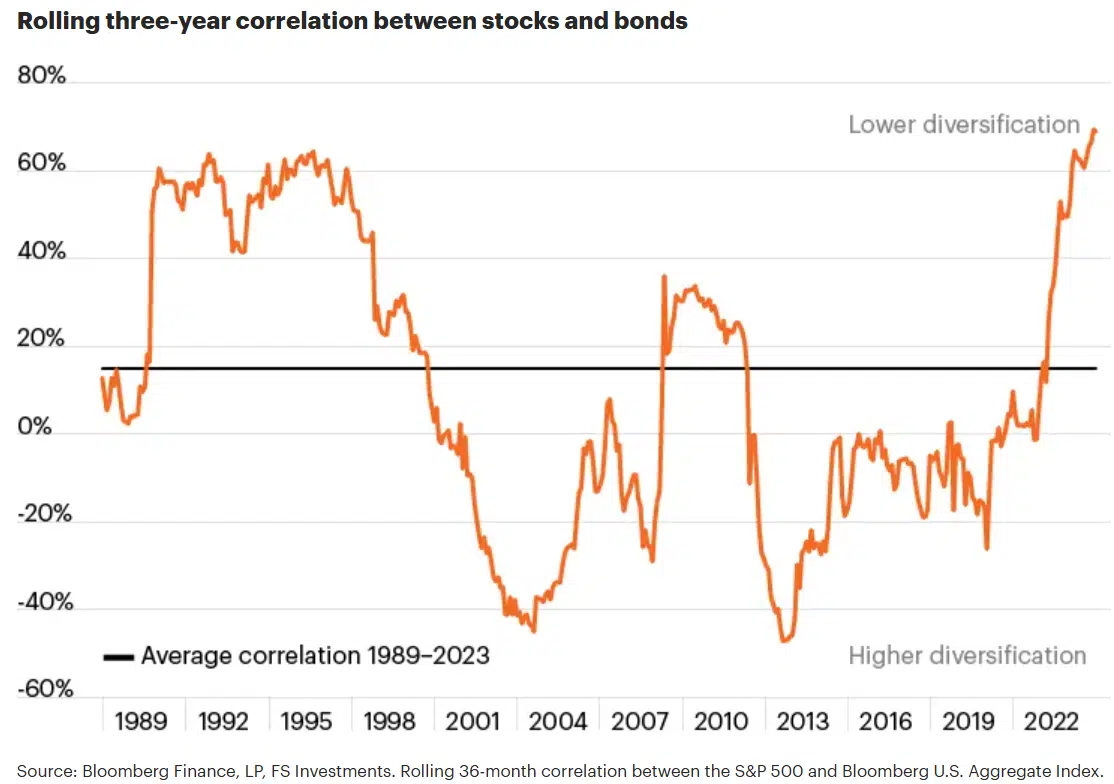
During times of market stress, all risky assets can decrease in value. Investors flee to safe harbors like Treasury bills and gold. This is one more reason to adopt a trend-following approach. Markets often show a loss of momentum before they drop sharply. Trend-based approaches can then exit before much harm is done.
Under Diversification
Investors often under-diversify by not using multiple approaches. Familiarity bias may also keep them focused on stocks and bonds. They may not realize, for example, that gold has outperformed the S&P 500 over the past 25 years.
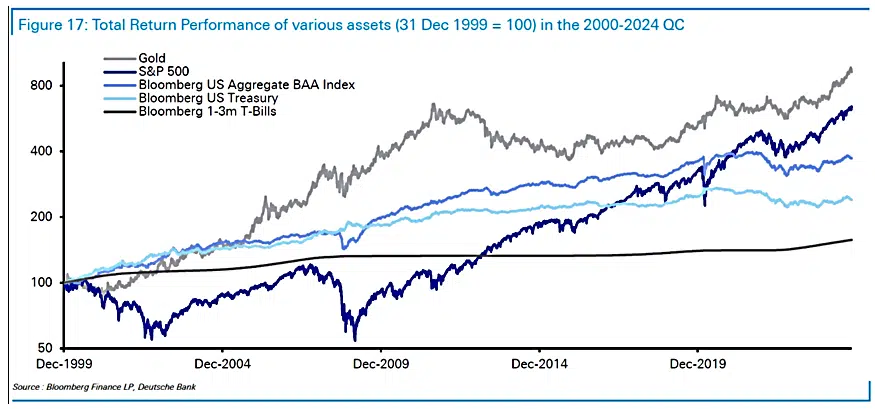
Central banks have been net buyers of gold for the past 15 years. This trend may persist as central banks continue to shift their reserves from the U.S. dollar to gold. It makes sense to apply systematic models to gold and boost its performance, since gold is such a good portfolio diversifier.
Another way investors under-diversify is by leaving assets out of their portfolios because of their biases as buy-and-hold investors. Over the past two years, our stock and bond models have outperformed their benchmarks while avoiding much of the market’s downside. But our two best-performing models have focused on blockchain technology stocks and gold when their trends are positive.
Over Diversification
It is also possible to over-diversify by including assets or approaches that add little or no value. I am sometimes asked why my models omit small-cap, value, commodity, managed futures, or inverse ETFs. These sometimes have short periods of outperformance. But even with trend filters, their inclusion would reduce our portfolios’ long-term performance. The same is true with adding buy-and-hold assets.
Warren Buffett said diversification (he meant over-diversification) is for those who don’t know what they are doing. Studying your models’ research should help you overcome the urge to under- or over-diversify.
Investors work hard to accumulate capital. They should also put in the time and energy to study the research underlying their investments. This could help them avoid making emotionally-driven decisions.