
I began my investment career in 1974 when investing was still in the dark ages. There was no online trading. All orders were placed by phone with a stockbroker (or trading desk, for institutions). Commissions were fixed and high, and investors traded too much, as seen here. As per the disposition effect, investors sold their winners too soon and held on to their losers too long.
People invested in companies they knew, had read about, or that were recommended. Brokers would pick a few stocks that had stories behind them. Aggressive investors would buy glamour/growth stocks, while conservative investors would hold bonds or defensive stocks.
But to reduce idiosyncratic risk, investors need to hold well-diversified portfolios of at least 25 stocks. Biased portfolios like those above would need more stocks.
Active Investing
Actively managed mutual funds emerged to solve this problem, exposing investors to greater numbers of stocks for a fee. But fund managers buy and sell stocks based on public information, making it difficult for them to outperform one another. Research shows that most actively-managed equity mutual funds also underperform their benchmarks.
Even the funds that outperform carry unforeseen risk for investors. Funds like Magellan and CGM Focus, delivered high returns, but also high volatility. Higher volatility caused the average investor in those funds to earn little or no money because they bought high and sold low, driven by fear and greed.
Passive Investing
Vanguard was the first large firm to offer an index fund in 1976. It was known as “Bogle’s Folly,” since was Vanguard’s founder, John Bogle’s idea to offering such a fund to the public.
At that time, hardly anyone wanted to settle for being average. Most investors wanted to be above average, as per Lake Wobegon. Since then, index funds have gained acceptance based on their relative performance and lower fees. Now, 53% of investing is passive, up 83% over the past 10 years.
Strategic Asset Allocation
But two problems remain. First, most equity funds, whether active or passive, experience extreme drawdowns from time to time. These can cause investors to panic and sell their holdings at the most inopportune times. The typical way of dealing with that is through asset diversification, usually with bonds. This is the most common way people invest. It is now known as strategic asset allocation. But as Mark Twain said, “Whenever you find yourself on the side of the majority, it is time to pause and reflect.”
Bonds have a lower long-term return than stocks, and their use will reduce one’s portfolio return and terminal wealth. There has been negative correlation between stocks and bonds at times. But over the long run, stocks and bonds are as likely to show positive as negative correlation.
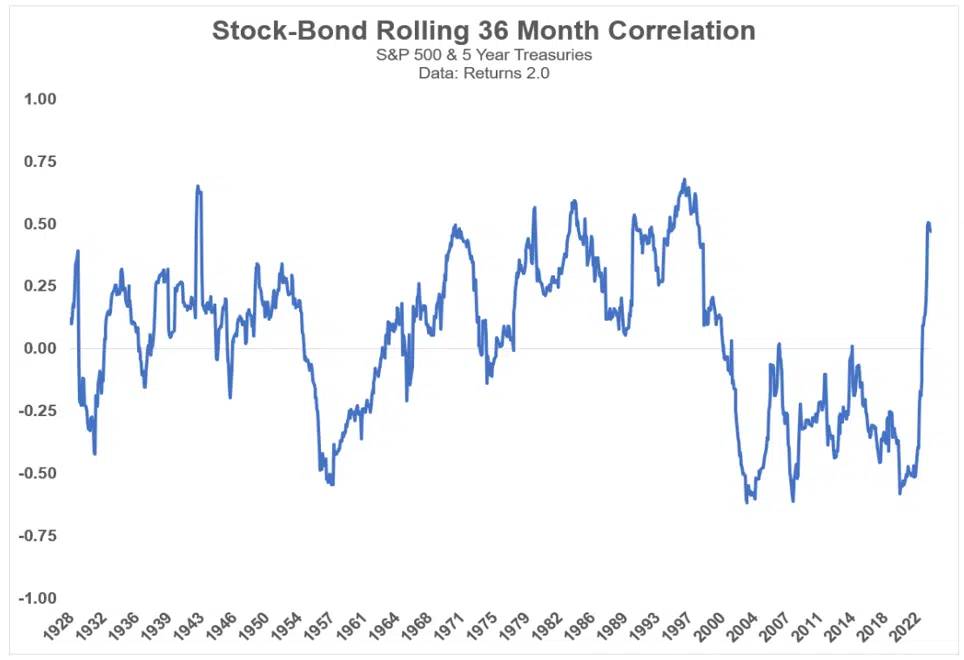
This means bonds may provide little or no diversification value when stocks are in a bear market. Investors had a rude awakening in 2022 when both stocks and bonds suffered significant losses. This has been true many times in the past. Since WW2, the 60/40 portfolio has had several 40% drawdowns and several more 30% ones.
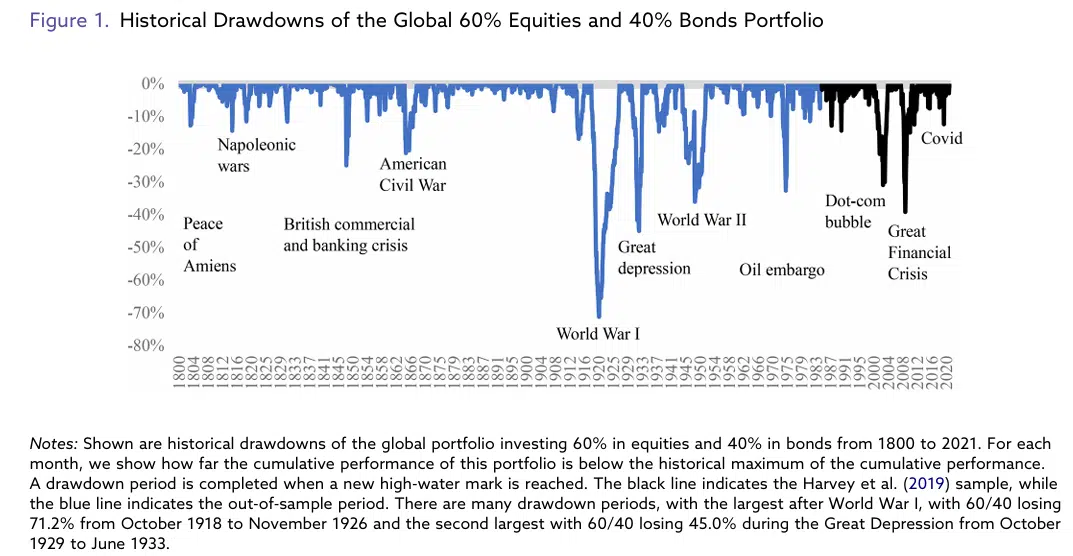
Source: Baltussen, Martens, & Linden (2025)
The second issue concerns stockbrokers and investment advisors. Investments are often sold, like used cars, rather than bought. How can these professionals justify their fees if their clients are in passive index funds? They could construct portfolios of stocks but would have the same issues as investors who do this themselves. Alternatively, they could diversify among different market factors, such as small cap, value, international, etc. Investors often think more is better, when the opposite is usually true.
Factor Investing
In 2017, I wrote an article showing the fallacies of factor investing. Around then, fund sponsors were issuing more and more factor and multi-factor-based funds. Since then, factor investing has delivered disappointing results. The Bloomberg–Goldman Sachs US Equity Multi-Factor Index, which tracks the long–short performance of classic style premia, has delivered a Sharpe ratio of just 0.17 since 2007 (t-stat=0.69, p-value=0.25), statistically indistinguishable from zero before costs.
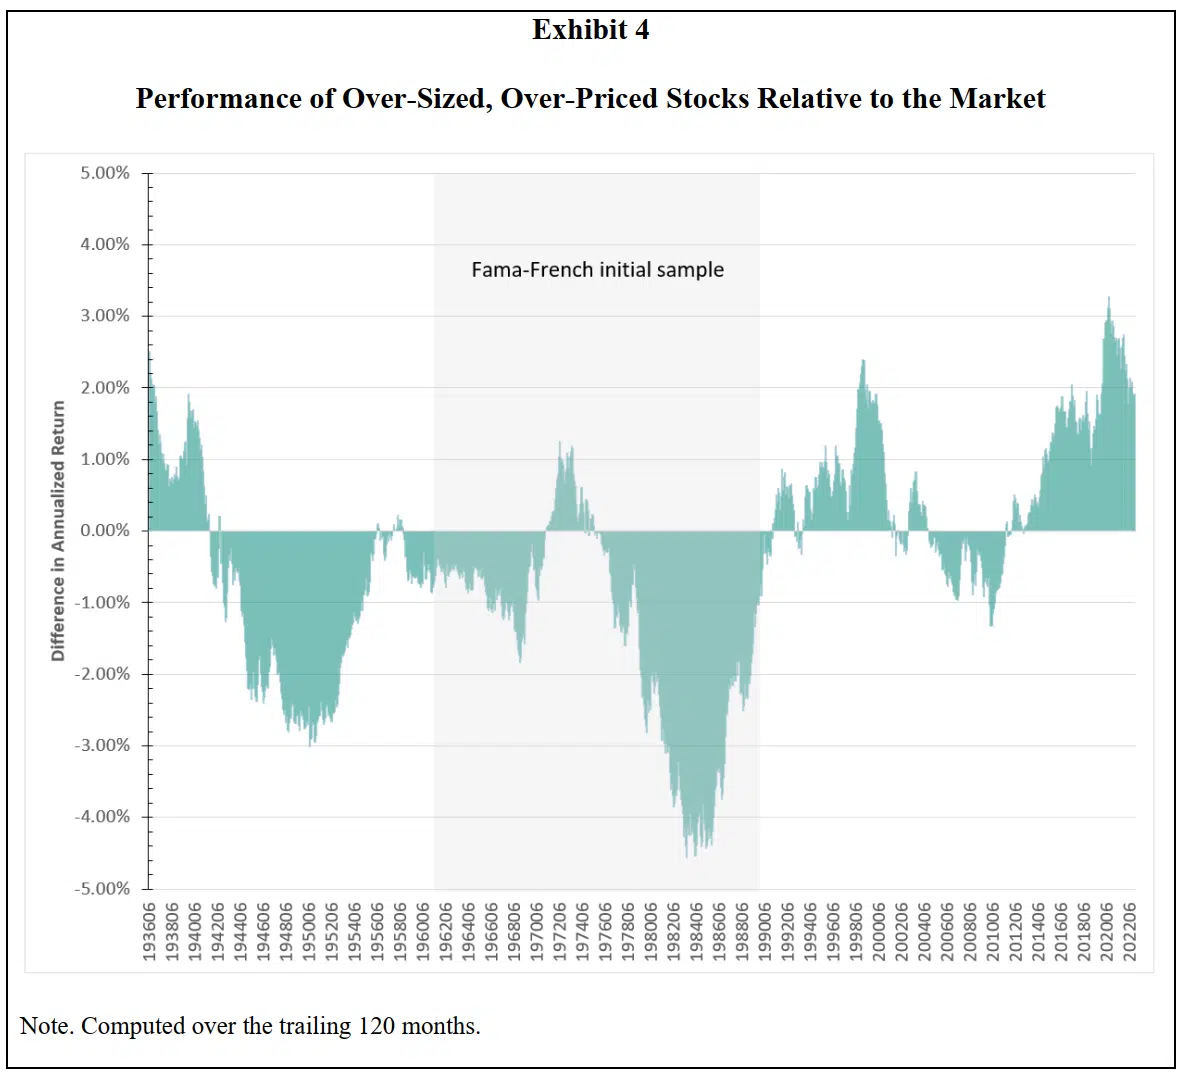
The most used factors are value and small-cap. These factors have delivered disappointing results just like the others. Here are the results of their opposites versus the market. During and before the Fama-French sample period, value and small-cap outperformed. Since then, the opposite has been true.
Results have been disappointing because the basis of factor investing is flawed. In 2019, a Research Associates article explained the underperformance of factor investing. More recent research attributes factor underperformance to data mining that has not held up out-of-sample.
Marcos Lopez de Prado and his colleagues agree with this. They also show here, here, here, and here that factor investing suffers from the classic principle that correlation is not the same as causality. A rooster crowing at dawn does not cause the sun to rise. Researchers found factor-based explanations for market returns but failed to establish causality.

Besides producing disappointing results and being based on a foundation that is suspect, factor investing also does little to reduce large drawdowns that cause investors to act in ways contrary to their best interests.
Macro Valuation
The most celebrated factor has been value. All multi-factor funds include it, even though Loughran & Hough showed in 2006 that the value premium was non-existent or insignificant in both large and small stocks. But valuation does have some merit on a macro level.
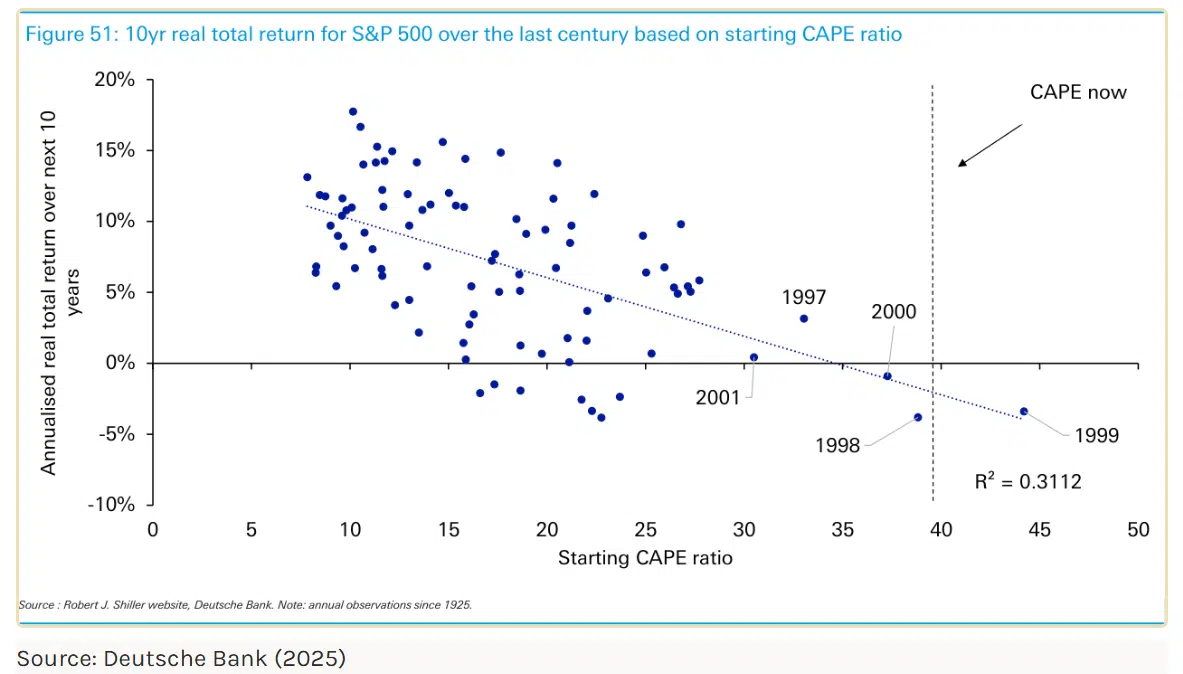
There are times when the stock market becomes greatly overpriced or undervalued. There are reliable ways to determine this, such as the Cyclically Adjusted Price Earnings (CAPE) ratio, Tobin’s Q ratio, and the ratio of Equity Market Value to GDP. The CAPE ratio has the most research behind it, as seen here, here, here, and here.
All three ratios are strong predictors of expected returns over the next 10 years. At the current level of over 40, the CAPE ratio indicates negative returns over the next decade. Buy-and-hope investors are likely to be disappointed.
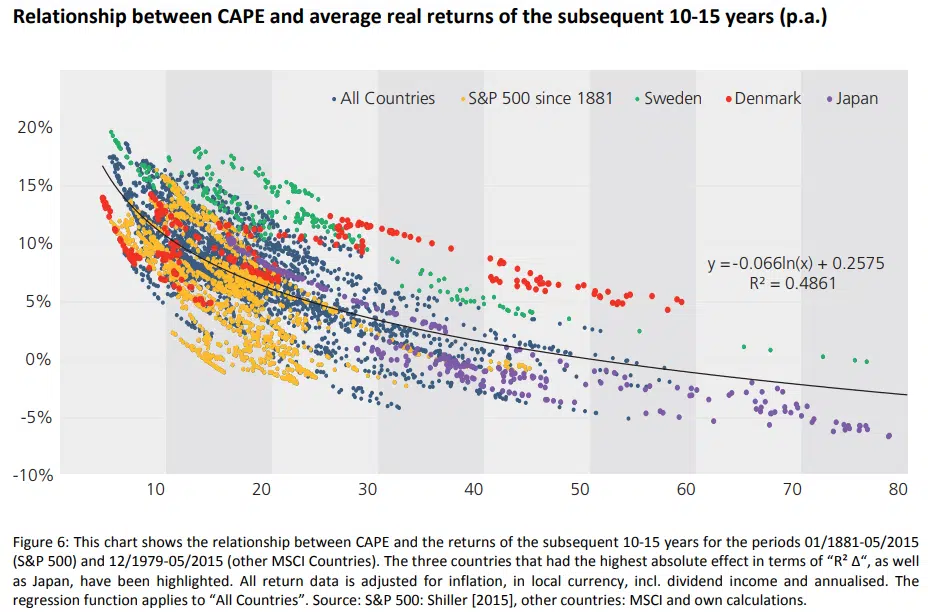
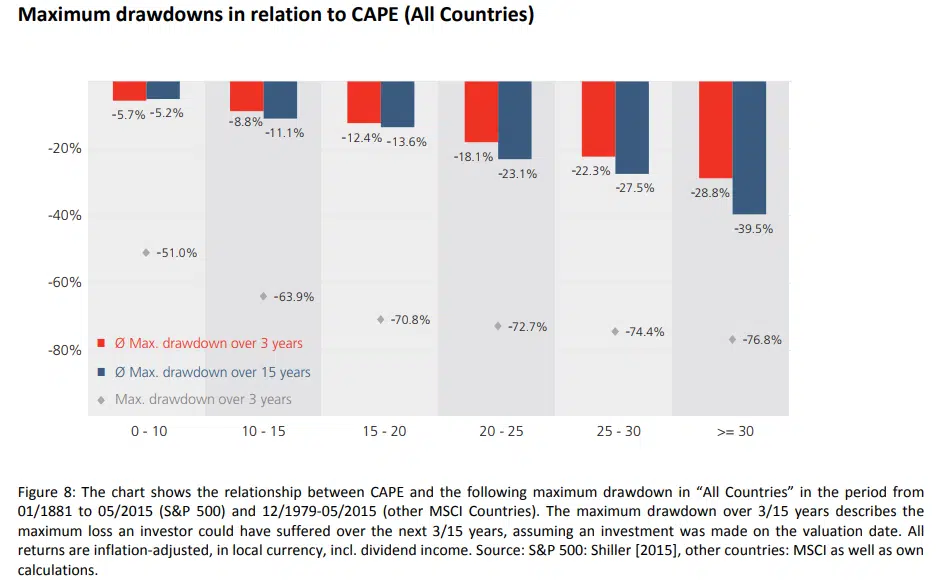
The probability of a severe stock market drawdown greatly increases when the CAPE exceeds 30.
But macro-valuation is rarely used for market timing. The stock market can continue rising for years after it becomes overvalued, or continue falling for years after it becomes undervalued.
What to Do?
 Strategic asset allocation still has considerable downside risk exposure, as well as lower expected returns than the stock market. Nor does factor investing solve these problems,
Macro-valuation tells us stock market investors will be disappointed with their returns over the next 10 years and have the risk of large drawdowns. So, what can one do?
Quantitative Investing
We can learn from those who have mastered the markets. Before his passing, Jim Simons, founder of Renaissance Technologies, was the world’s most successful hedge fund manager. I encourage everyone to read his biography to see what returns are possible. Simons’ great success was due largely to three things. First, he had an army of researchers who continually looked for quantitative edges (alpha). Second, he used copious amounts of data to validate his models. Third, he combined all their edges into an intelligent portfolio framework. We have been successful using the same principles with our proprietary models over the past few years.
There are two main forces behind quant investing. They are trend following and its opposite, mean reversion. Trends work best on an intermediate time frame, while mean reversion works best short-term when going against overreactions. Both have their basis in the behavioral anomalies of inertia and underreaction, or short-term overreaction, to new information.
Trend Is Your Friend
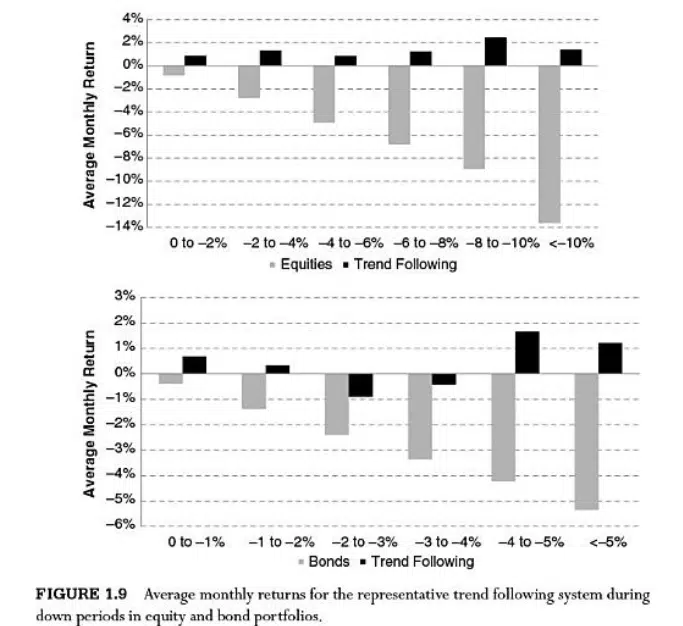
Many investors and money managers relegate trend following to the futures markets. This is a mistake. Greyserman & Kaminisky (2014) show that a simple rate-of-change trend filter, comparable to our absolute momentum approach, has earned higher returns than buy-and-hold with stocks and bonds since the creation of those markets.
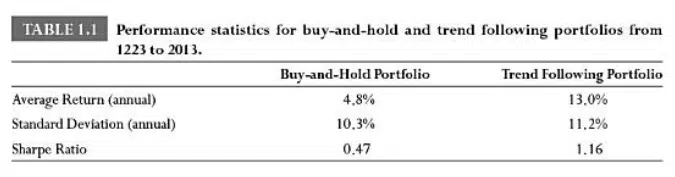
Trend following also had less risk exposure during drawdowns in both stocks and bonds.
Another Approach
There are other ways to identify and follow trends. Our recent award-winning paper shows how a simple channel breakout timing approach performs versus passive investing when applied to 98 years of stock industry data.
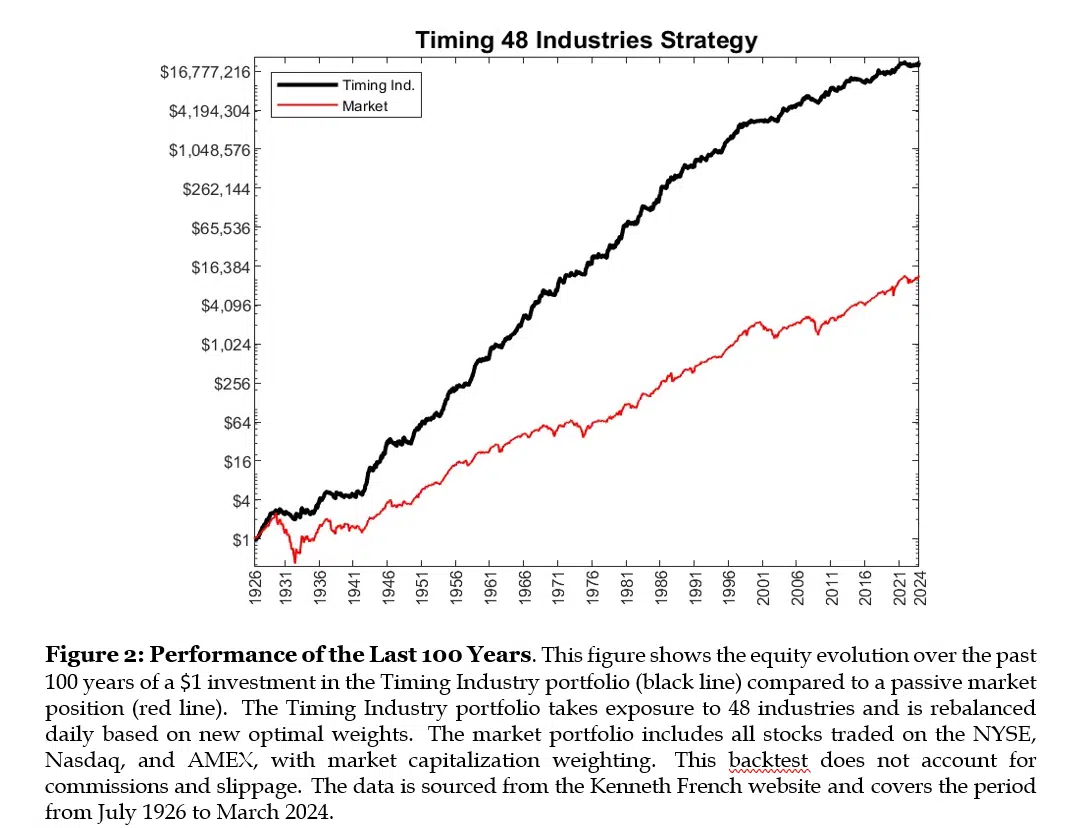
The timing portfolio appreciates on average by 18.2% per year with an annual volatility of 12.6%, resulting in a Sharpe Ratio of 1.39. During the same period, the US equity market yields 9.7% per year with a volatility of 17.1% and a Sharpe Ratio of 0.63. The timing strategy reduces the drawdown of a passive long market exposure by almost 60%. The active portfolio suffers a maximum loss of 33%, while a passive buy-and-hold exposure results in a maximum loss of 84% and a longer recovery period. Jack Dreyfus became a billionairre buying stocks making new highs, which is a channel breakout approach. Between 1953 and 1964, his Dreyfus fund returned 19.4% a year) compared with 14.6% for the Dow. Not only was it the best-performing mutual fund, but its returns were 102% higher than the fund that came in second place.
Other Trend Following Approaches
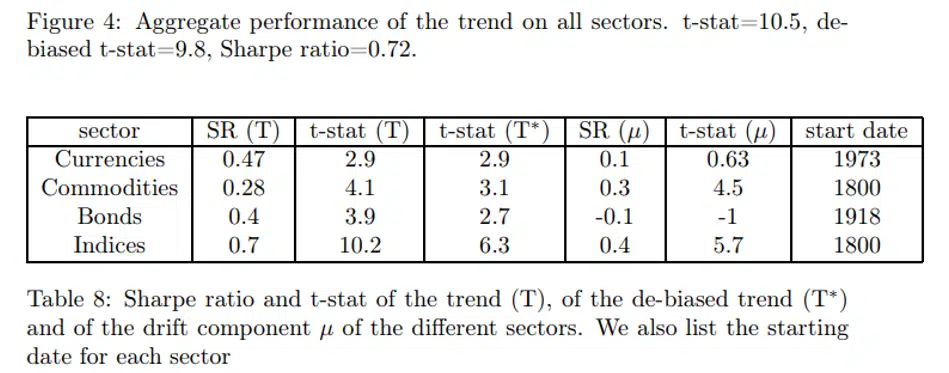
Moving averages are another common method of trend following. Lemperiere et al. (2014) show excess returns on over 200 years of data using exponential moving averages. The best results were with stock indices.
Brock, Lakonishok, and LeBaron (1991) look at moving averages and trading range breaks applied to 89 years of DJIA data. They found strong support for the technical strategies they explored.
The definitive work on moving averages is in the Ultimate Moving Average Handbook by Zakamulin & Giner (2025). It is a thorough scientific study of most types of moving averages and their variations like zero-lag models and MACD.
Lo, Mamaysky, and Wang (2000) applied pattern recognition to popular charting patterns in U.S. stocks. They found several technical strategies that have practical value.
Mean Reversion and Other Return Sources
To accumulate alpha, you usually need to combine different approaches that are not strongly correlated. Mean reversion is the opposite of trend following. It works because it uses a much shorter timeframe than trend following.
There are many ways to identify and use mean reversion. One of the earliest studies of mean reversion was in 1988 by Lehmann. He found winners and losers in one week had sizeable return reversals the following week.
In a 2013 study, Kudryavtsev found significant positive returns buying stocks with high intraday downside volatility and selling stocks with high intraday upside volatility.
Trend-following and mean reversion complement each other. Mean reversion buys weakness and sells strength, while trend-following buys strength and sells weakness.
Other sources of alpha include intermarket confirmation, seasonal aberrations, and price acceleration. Combing mean reversion and other return sources with trend-following and intelligent portfolio diversification is the key to modern quantitative investing.
What’s Next?
It took 7000 scientific studies showing that smoking leads to severe health issues before the Surgeon General issued his warning in 1964. It has taken 60 years since then for the percentage of U.S. adult smokers to drop from 45% to 11%.
The first index fund became available to the public in 1976. It was initially the subject of scorn and neglect, as is most disruptive ideas. Now 50 years later, there is $5 trillion invested in index funds. They are expected to soon represent 80-90% of all invested assets.
Years from now, when there is more research and practitioner results showing the efficacy of quantitative investing, investors may move beyond the dark age of strategic asset allocation and buy-and-hope.