
According to Morningstar, as of June 2016, the assets in smart beta exchange-traded products totaled $490 billion. BlackRock forecasts smart beta investing using size, value, quality, momentum, and low-volatility factors will reach $1 trillion by 2020 and $2.4 trillion by 2025. This annual growth rate of 19% is double the growth rate of the entire ETF market. Are factors the cure-all for our investment needs? Or are they more like “active management” that almost everyone wanted instead of passive index funds in the 1970s?
No one wants to be just average. This ironically gave most investors below average returns as they used the same information to compete against one another for the same returns. Superior performance was usually due more to luck than to skill. Bill McNabb, CEO of Vanguard, pointed out it has been passive index funds that have been in the top quartile of long-term performance.
Factor-based investors and advisors now think they have an advantage. They base this largely on the results of theoretical asset pricing models. Investors have lost sight of the fact that factors were once called risk factors. If factors offer higher returns because their risks are higher, do they really provide an advantage to investors? Small-cap stocks, for example, may offer higher returns. But their volatility and survival risks are also higher. Value stocks may offer higher returns over the long run, but they may have extended periods of underperformance. They may fall into a value trap where they stay undervalued or go out of business.
What investors really want is a factor premium that exists after accounting for risk. But Mr. Market is not usually disposed toward providing a free lunch.
Factor-based investing may offer some advantages to passive index investing. There is plenty of information that makes a case for factor-based investing. We won’t be covering that here. We feel it is important to examine both sides of this issue. Asset pricing models often look at long/short returns without taking proper account of the price impact of trading as well as other issues. Factors that looked good on paper may be lacking in robustness, pervasiveness, persistence, or intuitiveness. Let us look at these issues more closely.
Does Size Matter?
The small-cap size premium was first identified by Banz in 1981. His results were influenced by extreme outliers from the 1930s. Looking at more recent history, the oldest small-cap index is the Russell 2000. It started in January 1979. Here is the Russell 2000 annual return and volatility over the life of the index compared to the S&P 500 index.
The Russell 2000 underperformed the S&P 500 by 1.3% annually and had a higher standard deviation. The Russell 2000 thus underperformed on both a risk-adjusted and non-risk-adjusted basis.[1]
Here is a chart comparing the Sharpe ratios of all small and large-cap stocks over a longer period of time. Small-cap stocks failed to show significantly higher risk-adjusted profits than large-cap stocks.
In the table below long-only small caps slightly outperformed large caps globally since 1982. But small caps have underperformed large caps in the U.S. since 1926. Where is the outperformance that Banz talked about?
According to Shumway & Warther (1998) in “The Delisting Bias in CRSP’s Nasdaq Data and its Implications for the Size Effect”, small caps originally showed a premium because they had an upward bias due to inaccurate returns on delisted stocks. When this bias was removed, the small-cap anomaly disappeared. Just 37% of small-cap stocks have holding period returns greater than one-month Treasury bills, versus 69% of stocks in the largest decile.
In “Transaction Costs and the Small Firm Effect,” Stoll & Whitney (1983) showed that transaction costs also offset a significant portion of the small-cap size premium.
Some construct their own factor pricing models that show a small-cap premium if you combine size with other factors. In other words, size matters depending on what you are able to do with it.
Front Running
Some attribute the poor performance of the Russell 2000 index to the actions of front runners. Index replicators follow formulas for trading. They have little control over what and when to trade. Their trades are also known by the public ahead of time.
I pointed out in my last post that front runners cost S&P GSCI index investors 3.6% in annual return. Front running can happen with any index or factor-based strategy having known portfolio rebalancing dates.
Front runners can initiate trades ahead of index replicators or smart beta fund managers. They take profits after the replicators and fund managers finish their trading. Front runners thereby capture part of the factor or index return at the expense of index and fund investors.
If I were still managing hedge funds, I might front-run rules-based strategies like value or momentum. These strategies often hold less liquid, more volatile stocks that offer the highest front-running profits. Momentum would be a particularly attractive target. Its high portfolio turnover means more opportunities for profit.
Value – The Price is Right?
We all like bargains. Advisors and fund sponsors play off of that desire by promoting the idea of a value premium. This past month I read two investment blogs saying cheap value stocks have outperformed the market by 4% per year.
According to Asness et al. (2015), the only time there seemed to be a significant positive value premium in large-cap stocks was over the in-sample 1963-1981 period. Over a longer 88-year period, there was no significant large-cap value premium. They argued that value might still be useful as a diversifier in multi-factor portfolios. But they base that on their own factor formulations.
Kok, Ribando, & Sloan (2016) showed that strategies using common fundamental metrics of value, such as book-to-market or earnings-to-price, do not deliver superior performance. Instead, these ratios identify firms with temporarily inflated accounting numbers that tend to mean revert.
Loughran and Hough (2006) looked at the performance of all U.S. equity funds from 1962 through 2001. They used the prior 36 months to sort funds by book-to-market (top versus bottom quartile) and size (top versus bottom half).
Equal Weighted Mutual Fund Returns 1965 to 2002
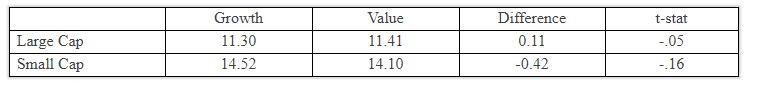
Source: Loughran and Hough (2006), “Do Investors Capture the Value Premium?”
From 1965 through 2001, the average large-cap growth fund returned 11.30% per year, while the average large-cap value fund returned 11.41%. The outperformance of 0.11% for large-cap value overgrowth was insignificant.
With small caps, the authors were expecting different results. They were surprised that small-cap value funds earned 14.10%, while small-cap growth funds returned 14.52%. Small-cap value underperformed small-cap growth by 0.42% per year.
Israel & Moskowitz (2012) show that the value premium is insignificant among the two largest quintiles of stocks and is concentrated among small-cap stocks. These results are robust over 86 years of U.S. equity data and almost 40 years of data across four international markets.
Why then did small-cap value funds underperform small-cap growth funds? Loughran and Hough said wide bid-ask spreads and the price impact of trading worked against the capture of a value premium in small-cap stocks. For value investing in general, they concluded, “We propose that the value premium is simply beyond reach…investors should harbor no illusion that pursuit of a value style will generate superior long-run performance.”
Some practitioners try to excuse these results by saying there are better valuation metrics than book-to-market (B/M). But the Israel & Moskowitz results were similar using valuation measures other than book-to-market. Kok, Ribando, & Sloan (2017) also found “remarkably consistent results” using different valuation ratios and weightings. Loughran & Wellman (2010) found only a .02% per month difference in performance between book-to-market (HML) and the enterprise multiple (EM), another popular valuation metric.
Some who believe in the superiority of value or small-cap investing point to the performance of the Dimensional Fund Advisors (DFA) funds. Their U.S. Small Cap Portfolio (DFSTX) began in March 1992 and was the first factor-based small-cap fund. DFA’s U.S. Large Cap Value Portfolio (DFLVX) and U.S. Small Cap Value Portfolio (DFSVX) funds began in February and March of 1993. All these funds have positive alphas. But none of the alphas are statistically significant.[2] To the extent that the DFA funds have done reasonably well may not be entirely due to their factor tilts.
DFA serves as a market maker in the stocks they hold. This means they can be patient when adjusting portfolio positions. That reduces their costs of trading in exchange for some additional tracking error. Using a buy-sell range also reduces turnover and trading costs. Holding a large number of securities further reduces the price impact of DFA’s trading.
DFA has also benefited from not being tied to an index and thereby subject to front running costs. DFA has been aggressive in lending securities for a fee. Additionally, DFA uses momentum and profitability to filter its trades.
They also generally avoid IPOs and stocks with high borrowing costs. Stocks with high borrowing costs often have a large short interest. This means there is a limited supply of stock available for borrowing. Studies here and here show that heavily shorted stocks have negative abnormal returns, while lightly shorted stocks outperform their benchmarks. DFA has benefited considerably from avoiding stocks with high short interest.
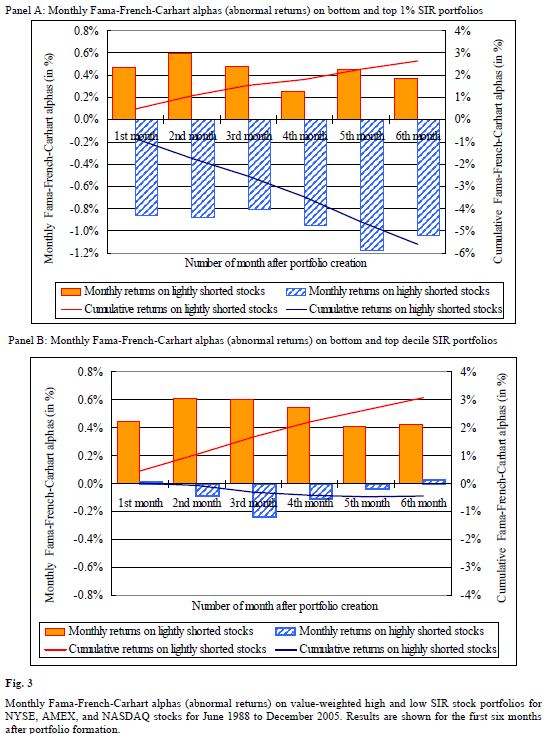
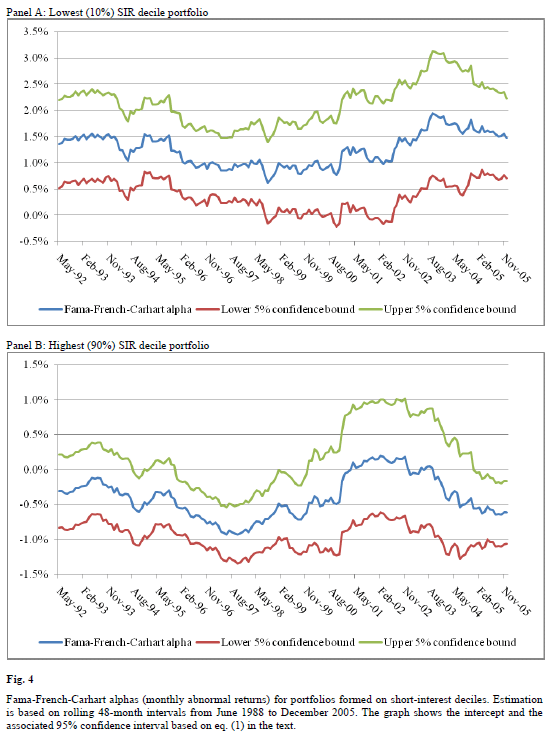
Source: Boehmer et al. (2009), “The Good News in Short Interest”
Risk Factors
People may not remember that factors were once called “risk factors.” Value funds have tracking errors that can persist for 10 or more years. Tracking error is a form of risk. It can cause investors and money managers to liquidate their positions at inopportune times.
Another risk is scalability. It might not be possible for popular strategies like value to always maintain an advantage over the market. This is particularly true of value stocks that are often out of favor and ignored. This can make them less liquid and more expensive to trade.
In “A Taxonomy of Anomalies Costs and their Trading Costs” Novy-Marx & Velikov (2015) looked at how capital levels can affect factor trading profits. Their calculations showed that excess profits disappear once the amount in value strategies exceeds $20.7 to $50.6 billion.
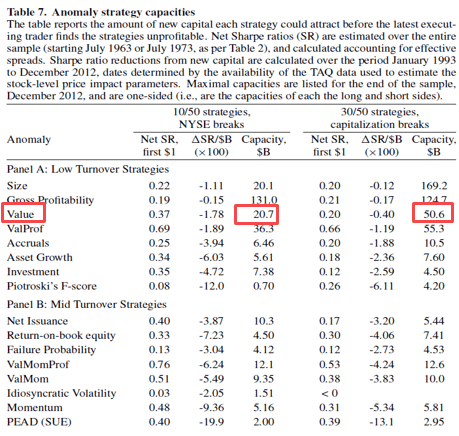
The Novy-Marx & Velikov capital levels are based on a turnover-reducing approach. It buys value stocks ranked in the top 10th or 30th percentile. But it does not liquidate them until stocks drop out of the top 50th percentile. DFA, MSCI, and others use a similar turnover-reducing approach.
Here is a chart showing the amount of capital invested in dedicated U.S. large and mid-cap value funds. It does not include managed accounts, hedge funds, and many of the other 400+ funds having the word “value” in their names.
This is close to the $5 billion amount where Korajcyzk & Sadka said momentum profits would disappear. Novy-Marx & Velikov used an optimization algorithm to keep them in trades longer, as discussed by Frazzini et al.
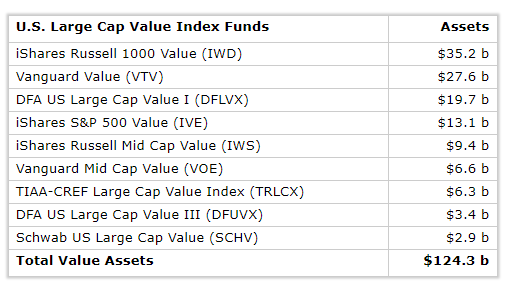
The $124.3 billion in value funds far exceeds the upper bounds where Novy-Marx and Velikov say value profits would disappear.
Momentum – the Premier Anomaly
Momentum is the strongest market anomaly based on academic research. Momentum has been studied now for more than 25 years. It meets all the tests of robustness, pervasiveness, persistence, and intuitiveness.
Momentum performs best in focused, concentrated portfolios. Momentum is a high turnover strategy. Momentum stocks are often volatile with wide bid-ask spreads. Trading billions of dollars around the same time in a modest number of volatile stocks may impact trade execution. It would be like trying to force a dozen people through a small door opening.
the price impact of momentum trading. One of the first studies of this was by Lesmond, Schill & Zhou (2002) in their “The Illusive Nature of Momentum Profits.” They found that momentum creates an illusion of profit opportunity when none really exists. Momentum is a high turnover strategy. Momentum stocks are relatively less liquid with disproportionally large trading costs. Two years later, Korajcyzk & Sadka (2004) found that profit opportunities could vanish once the amount invested in momentum-based strategies reaches $5 billion.
Counter to these findings, Frazinni, Israel & Moskowitz (2012), based on 16 years of actual AQR data, argue that the potential scale for factor trading is more than an order of magnitude greater than previous studies suggested. They said this capacity could increase even further by using optimized trading methods. But they show the actual cost of trading as more than 1/3 of gross historical factor returns. This should increase as factor-based investing continues to gain in popularity. Regarding momentum stocks, AQR has been trading non-focused momentum portfolios (over 400 stocks in their large-cap U.S. momentum fund). This may not be truly representative of the impact of momentum trading.
More recently, Ratcliffe, Miranda & Ang (2016) from BlackRock suggested that a greater amount of capital could be traded using momentum. In contrast to these two studies, Fisher, Shah & Titman (2015), using observed bid-ask spreads, got results much closer to those of Lesmond et al. and Korajcyzk & Sadka than Frazinni et al.
Novy-Marx & Velikov (2015) also determined the capacity for stock momentum before profits would vanish.
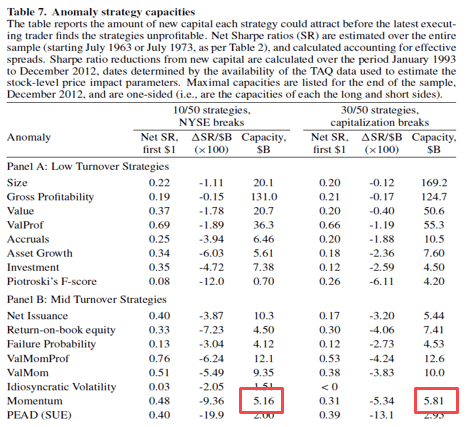
Here is a table of the amounts invested in U.S. momentum exchange-traded products:
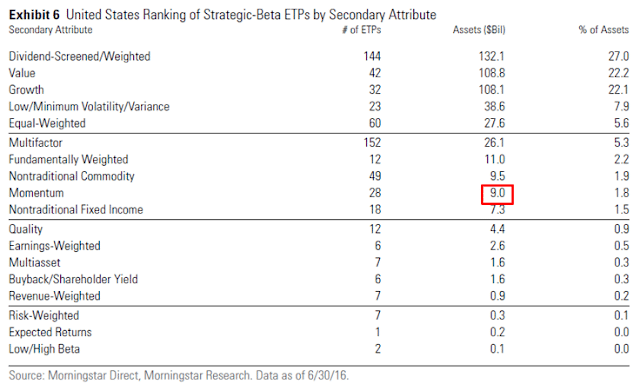
It does not include mutual funds, managed accounts, or hedge funds. Even so, it exceeds the level of assets where both Novy-Marx & Velikov and Korajcyzk & Sadka say momentum profits should no longer exist.
Here is a table from a recent study of factor capacity. It is by Beck, Hsu, Kalesnik & Kostka (2016) in “Will Your Factor Deliver? An Examination of Factor Robustness and Implementation Costs.” They used a different method than Novy-Marx & Velikov to compute factor capacity.
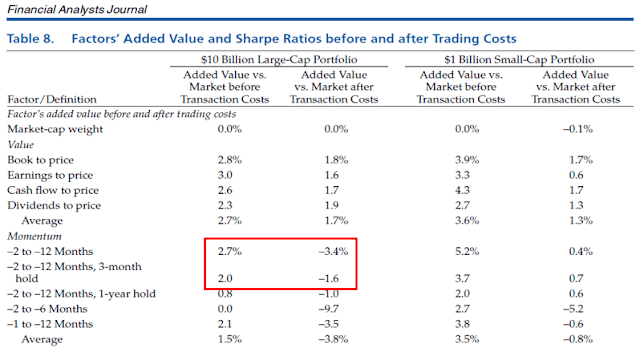
With $10 billion invested in large-cap momentum, the value added by momentum goes from +2.7% per year before transaction costs to -3.4% after transaction costs. This is with monthly portfolio rebalancing. If you rebalance quarterly instead of monthly, your additional annual return goes from +2.0% before trading costs to -1.6% afterward.
This situation is much like the one I discussed in my last post. Those offering commodity products to the public say passive commodities are still a worthwhile diversification. But independent researchers with no products to promote say the opposite. Who should we believe? Maybe practitioner data is better than academic data.
To help find out, we can look at the performance of the oldest publicly available momentum funds. First is the PowerShares DWA Momentum ETF (PDP) managed by Dorsey Wright. It began on March 1, 2007. The second is the AQR Large Cap Momentum (AMOMX) mutual fund. It began on July 9, 2009.
From its start through January 2017, PDP had an annual return of 6.44%, while its chosen Russell 3000 Growth benchmark returned 8.67%. This is an average annual return shortfall of 2.23%. PDP has a focused portfolio of 100 momentum stocks.
AMOMX had an annual return of 14.55% since its inception, while its chosen Russell 1000 Growth benchmark returned 16.11%. This is an average annual shortfall of 1.56%. Besides managing seven momentum mutual funds, AQR uses momentum with its multi-style funds and large hedge fund. AQR spreads its large-cap U.S. momentum holdings among 496 stocks. This is half the fund’s available universe of 1000 stocks. Research by Alpha Architect shows that momentum works best with focused portfolios of 50 or fewer stocks. Why wouldn’t AQR use more focused portfolios if there is little impact from trading momentum stocks?
Ten years of underperformance for PDP and 8.5 years for AMOMX are not long enough to draw meaningful conclusions. But there is another possible explanation for underperformance other than or in addition to trading costs. Momentum itself may have lost its mojo since it became widely known and followed in the 1990s.
Battacharya, Li & Sonaer (2016) found that momentum profits from U.S. stocks have been insignificant since the late 1990s. Robert Arnott of Research Affiliates said their research shows stock momentum has underperformed since 1993 [2]. This was the same year Jegadeesh & Titman published their seminal study on stock momentum. Hwang & Rubesam (2013) showed that the momentum premium for stocks disappeared in the early 1990s.
Quality
We can find intuitive reasons why size, value, and momentum might provide a premium based on risk, investor behavior, or market structure. This becomes more challenging with quality. Why should quality stocks be mispriced by the market? There is no reason to believe that higher-quality stocks are riskier than lower-quality stocks, which would require them to offer a premium for investors to hold them. It is also hard to find behavioral factors or structural impediments that would explain why one would neglect high-quality stocks causing them to command a behavioral premium. It is not surprising then that there are few signs of a premium or premium persistence across multiple definitions of quality.
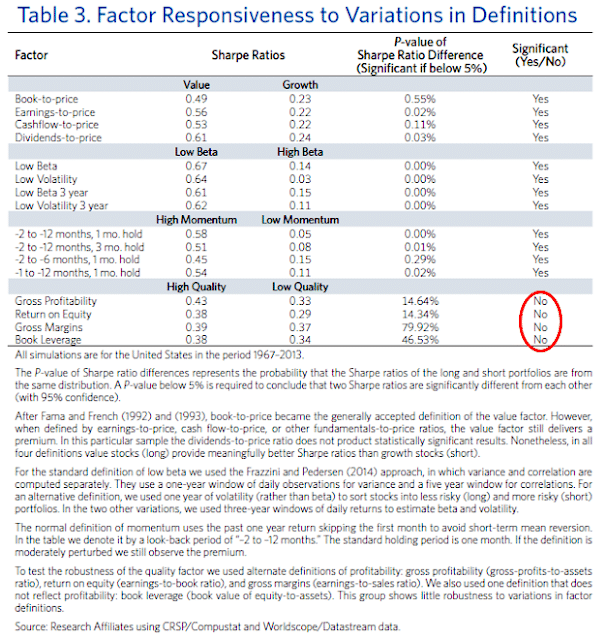
Cakici (2015) found only marginal evidence that gross profitability (a subset of quality) exists globally. Hsu & Kalesnik (2014) reported in “Finding Smart Beta in the Factor Zoo” that two measures of quality (gross profitability and ROE) in international stocks from 1987 through 2013 showed no significant improvement in Sharpe ratio over lower-quality stocks. They also found no evidence of a significant advantage using four measures of quality from 1967 through 2013 in U.S. stocks:
Multi-Factor Portfolios
West, Kalesnik & Clements (2016) in “How Not to Get Fired in Smart Beta Investing” included quality in a multi-factor environment.
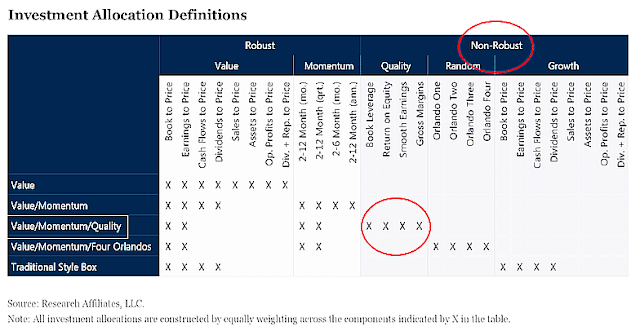
They determined that quality, value, and momentum are a non-robust combination. Why is this important?
More multi-factor ETFs were created in the last two years than any other category of ETF. In a January 2016 survey by Greenwich Associates, 57% of institutional investors said they used multi-factor funds in some way now. 48% said they plan to increase their use soon.
Multi-factor portfolios have less volatility and tracking error compared to single-factor portfolios. In “A Smoother Path to Outperformance with Multi-Factor Smart Beta Investing,” Brightman, Kalesnik, Li & Shim (2017) show that annual volatility drops from 16.4% for an average factor to 15.2-15.6% for a multi-factor portfolio. This reduction is desirable. But those familiar with portfolio theory know that factor portfolio returns are a weighted average of individual factor returns. If factor returns are disappointing due to a lack of scalability (value and momentum), data accuracy and persistence (size), or robustness (quality), multi-factor returns may also be disappointing.
On the positive side, a multi-factor approach can cut the benchmark tracking error in half. But would it really matter if 10 years of factor-based underperformance were reduced to 5 years? Small-cap value once underperformed the market for 42 consecutive months. If that had been 21 months, would it have made much difference? Most investors would have been gone long by then.
Low Volatility
In a Brown Brothers Harriman survey of 175 financial advisors and institutional investors, low volatility was the most popular smart-beta choice. 44% of respondents chose low volatility over other factors. One of the first anomalies that troubled academics was that lower beta or volatility portfolios performed better than should relative to higher beta or volatility portfolios. There may be a sound basis for low volatility outperformance. Leverage constraints can cause high-volatility stocks to be bid up so they are overpriced relative to low-volatility stocks.
However, low volatility is a problematic factor. The first cautionary sign is a chart of pre-1967 performance in the appendix of Novy-Marx’s (2016) paper “Understanding Defensive Equity.” Volatility and beta are estimated using daily data from the prior year when available. Otherwise, Novy-Marx uses 5 years of monthly data.
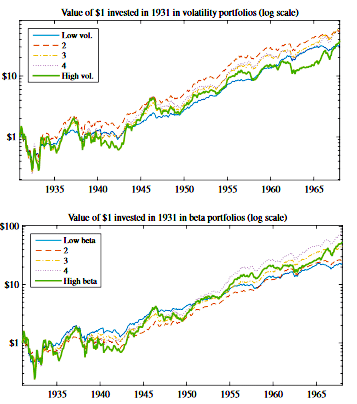
There is little difference between the lowest and highest volatility quintiles. With respect to beta, low beta is the worst performer, while high beta turns in the second-best performance.
Novy-Marx also pointed out that the vast majority of low volatility profits since 1968 came from the short side. He showed that most of the benefits from low volatility investing could be achieved simply by eliminating small growth stocks from one’s portfolio.
In “The Limits to Arbitrage and the Low-Volatility Anomaly,” Li, Sullivan & Garcia-Feijoo (2014) found that the excess return associated with low volatility was present only in the first month after portfolio formation. Additionally, the excess return has been weak since 1990. They also found that the low volatility premium was offset by high transaction costs. It was largely eliminated if you omitted stocks priced under $5 per share.
Garcia-Feijoo, Kochard, Sullivan & Wang (2015) in “Low-Volatility Cycles: The Influence of Valuation and Momentum on Low-Volatility Portfolios,” showed that the excess return from low-volatility is reliably positive only when low-volatility stocks are much cheaper than high volatility stocks as shown by a high book-to-price (B/P) ratio.
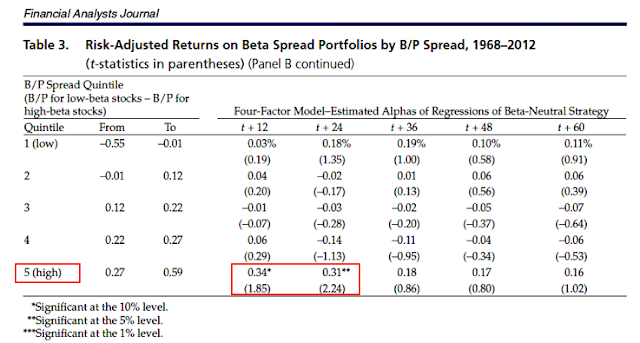
Using U.S. stock data from 1929 through 2010, van Vliet (2012) found low-volatility has had time-varying exposure to the value factor. When low-volatility stocks had value exposure, they returned an average of 9.5% annually versus the market’s 7.5%. But when low-volatility stocks had growth exposure, they returned 10.8% annually versus the market’s 12.2%.
Getting back to the idea of short interest, Jordan & Riley (2016) show in “The Long and Short of the Vol Anomaly,” that short interest dominates the low-volatility effect from July 1991 through December 2012.
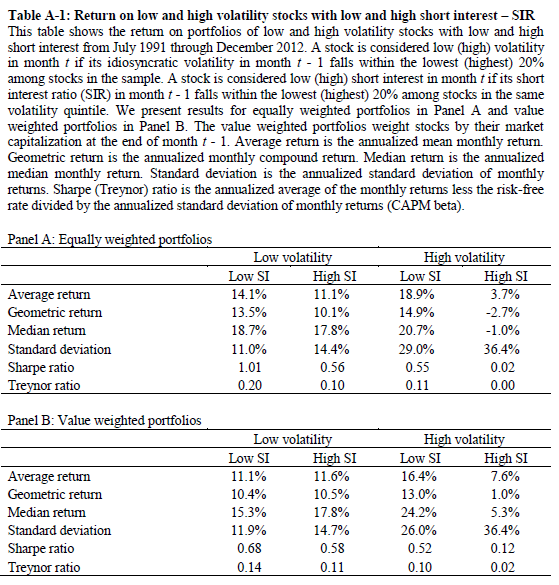
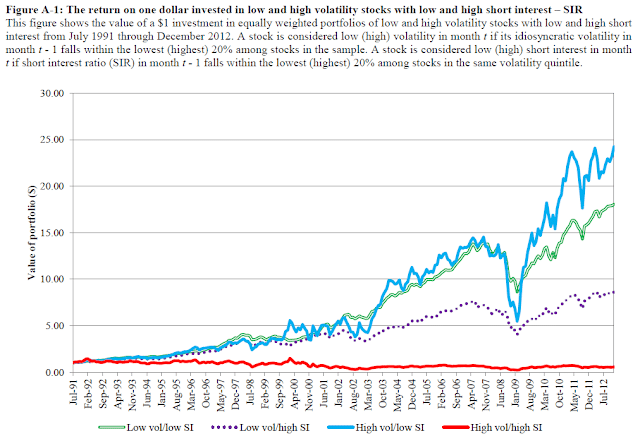
High volatility stocks with low short interest had extraordinarily positive returns. High volatility stocks with high short interest had extraordinarily poor returns. Low volatility stocks had a similar, but less dramatic, disparity in performance based on short interest. Short interest has had a large impact on low-volatility performance.
Summarized below are the issues associated with the low-volatility premium:
• Weak since 1990
• Absent in higher-priced stocks
• Exists mostly on the short side
• Largely offset by transaction costs
• Reliably positive only when cheap
• Not present in equal-weight portfolios
• Present only in the first month after formation
Less Downside Risk
With all these negatives, one might wonder why low volatility has been the fastest-growing factor. This may have to do with investors thinking low volatility has lower risk exposure than the market.
It is not surprising that investors are more risk-averse now. They have experienced two bear markets over the past 20 years where stocks lost half their value.
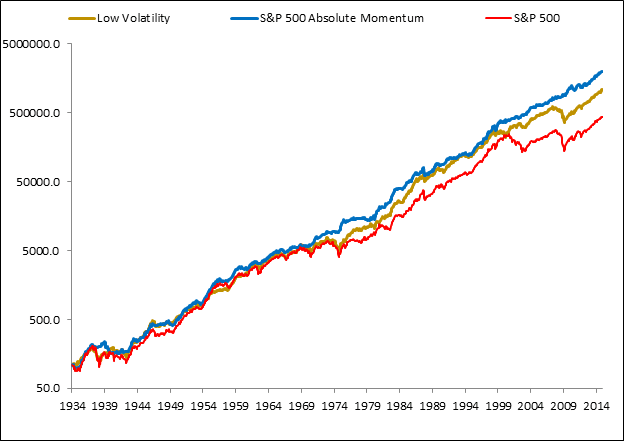
How much risk reduction is there really from low-volatility investing? To find out, I accessed the online data provided by van Vliet & De Koning. They used the 1000 largest NYSE, AMEX, and NASDAQ stocks over $1 per share in the CRSP database. Stocks were equal-weighted and sorted into deciles based on their volatility over the past 36 months. These portfolios were rebalanced quarterly.
I accessed the data starting in January 1934 to avoid the extreme returns of the late 1920s and early 1930s. I used the top two low-volatility deciles, representing 200 stocks, which is a typical fund-size portfolio. I compared the performance of the low-volatility portfolio to the S&P 500 and to a robust version of trend following absolute momentum that I use in my dual momentum models. Absolute momentum holds the S&P 500 when the model is in stocks and intermediate U.S. Government bonds when the model is out of the stock market. Data is from Ibbotson Associates.
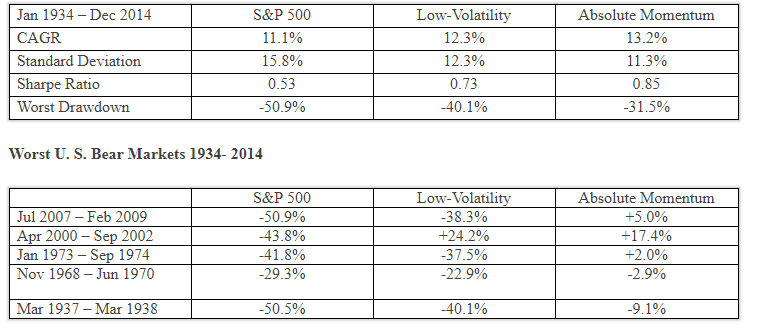
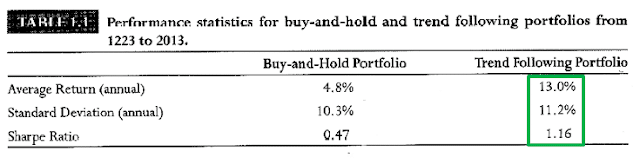
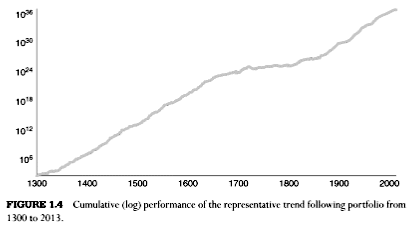
The viability of trend-following momentum back to the 13th century is strong evidence that it is not an artifact of data mining.
Conclusion
There are plenty of research papers and articles extolling the virtues of factor-based investing. Factors look good in theory and on paper. But whether they provide superior risk-adjusted real-world returns is another story [3]. Those promoting factor investing may be taking a page out of the political playbook. If you say something repeatedly, people will start to believe you and ignore contrary evidence. Investors may think they can do better than the market by using higher-cost factor-based investing. But not everyone can be above average.