Like most investors, those using momentum are often guilty of chasing performance. In fact, momentum requires that we do this. But it should be done in a disciplined and systematic way. Performance chasing should not be due to myopia, irrational loss aversion, or other psychological biases.
Behavioral Challenges
It is not always easy adhering to a disciplined approach. If you are not vigilant, emotions can get the better of you. Even Daniel Kahneman, the father of behavioral economics, admits to being influenced by behavioral heuristics.
We may forget our strategy’s long-term expected outperformance when we experience uncomfortable drawdowns. The survival instinct kicks in strongly then. Recency bias can make us feel the drawdown will never end.
We may also have to deal with regret aversion when our portfolio underperforms. This will happen sooner or later. No strategy outperforms all the time. Occasional benchmark underperformance is the price we pay for possible protection from severe bear markets.
Myopia
Those who look at performance frequently do not do as well as those who are less concerned with short-term performance. When someone asks me how my models are doing this year, I know they do not have a good understanding of momentum being a long-term approach. Last May a dual momentum investor sent me an email saying his wife’s account in REITs was outperforming his momentum account. He then closed his account and invested in REITS himself. Since then, REITs have declined more than 10%, while momentum has gone up almost the same amount. This scenario has happened more frequently than you might think.
It is important to keep the big picture in mind. We should wait for at least a full bull and bear market cycle before evaluating the performance of a dual momentum strategy. Do your homework so you understand whatever investment approach you select. Then relax, and enjoy the journey.
Accepting Lower Risk Premia
The other serious mistake momentum and other investors often make is not understanding the real goal of investing. We should invest in a way that offers us the highest expected return while limiting our risk exposure. Limiting downside exposure is important so we do not panic under stress and do stupid things.
The stock market has had two bear markets over the past 20 years in which stocks lost more than half their value. Because of this, investors have been extra cautious. Many have tried to use broad diversification to reduce their portfolios’ drawdown exposure.
If you select non-correlated assets, you can achieve some reduction in volatility and drawdown. But your expected return is the weighted average return of all your assets. That is where the problem lies. Assets with lower expected returns will reduce your portfolio’s return.
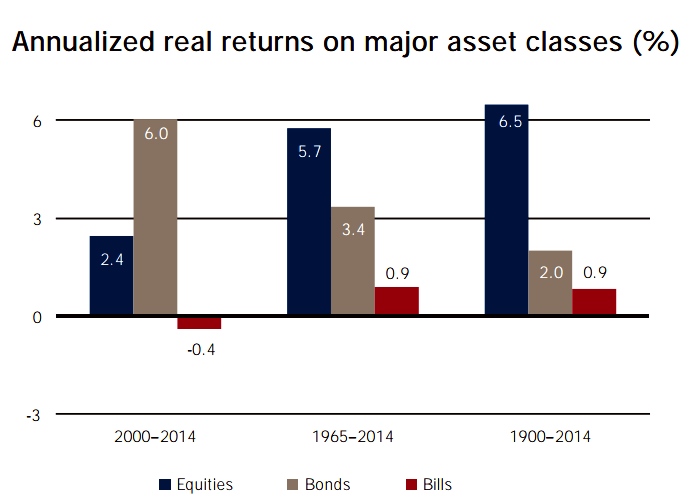
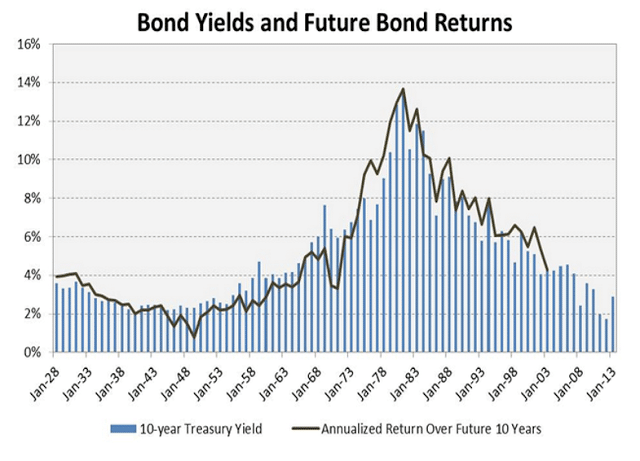
Bonds have done well over the past 15 years. But longer term, their real return is less than one-third the real return of stocks. Given how low interest rates are now, there is not much room for bonds to appreciate further. In fact, current interest rates predict low bond returns in the years ahead.
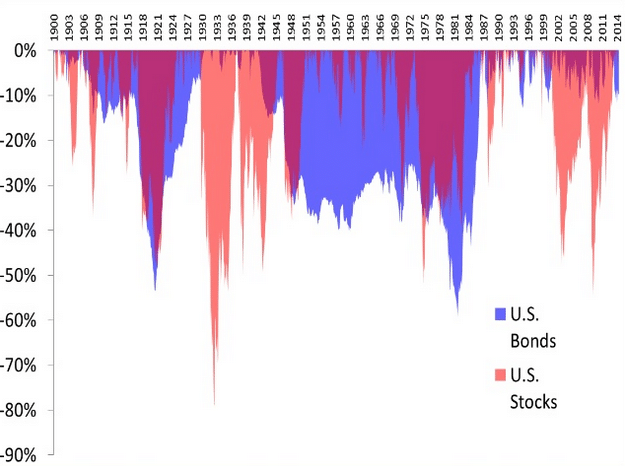
Bonds are also not as low-risk as you might think. Since 1900, the worst real return drawdown was 73% for stocks and 68% for bonds. As we see below, stocks and bonds can sometimes have severe drawdowns simultaneously.
Bonds can not only create a drag on our performance. They also may not reduce our risk exposure when we most need them to do so.
Some momentum investors still adhere to the old paradigm of extensive diversification. They hold more assets than they need to for optimal portfolio growth. Some use alternative assets like commodities because such assets are generally (but not always) less correlated to equities. They can thus reduce portfolio volatility. But the addition of low-return alternative assets can create a serious drag on portfolio performance. Trend following absolute momentum lets us keep more of our assets in equities where we can receive more risk-premium.
Not Using Geographic Diversification
My first research paper released in 2011 analyzed equity momentum with individual stocks, sectors, style attributes, and regions. I showed that momentum works best when applied to geographically diversified equity indices. Last year Geczy and Samonov (2015) applied momentum to stocks, stock sectors, geographic equity indices, bonds, commodities, and currencies. They also found equity indices performed best. This is without considering the issues of scalability and trading costs associated with individual stocks.
Preference for Complexity
Investors and advisors seem to prefer complexity over simplicity. Many believe that elaborate models and more diversified portfolios perform better than simpler approaches. Advisors may prefer complexity to justify their fees. It could be challenging to charge fees for putting clients in an S&P 500 index fund. Robo-advisors are the latest slice and dice diversification strategy for those who think more is better.
Non-Optimal Portfolio Construction
Some portfolios suffer because investors rely on well-known measures like the Sharpe ratio for selecting assets. The Sharpe ratio divides excess returns by the standard deviation of those returns. It is an efficiency measure telling you how much return you might expect per unit of volatility. But unless returns are normally distributed (they almost never are), the Sharpe ratio is not a good indicator of downside risk. Nor is it a good indicator of the amount of wealth you might accumulate or your chance of future investment success.[1]
Wiecki et al. (2016) looked at 818 algorithmic trading strategies at Quantopian, a research boutique. Using data from 2010 through 2015, they found that the Sharpe ratio offered little value in predicting out-of-sample performance. This was also true of similar metrics such as the information ratio, Sortino ratio, and Calmar ratio.
You can increase the Sharpe ratio of most portfolios by simply adding more bonds. But your expected rate of return and accumulated wealth will in most cases suffer.
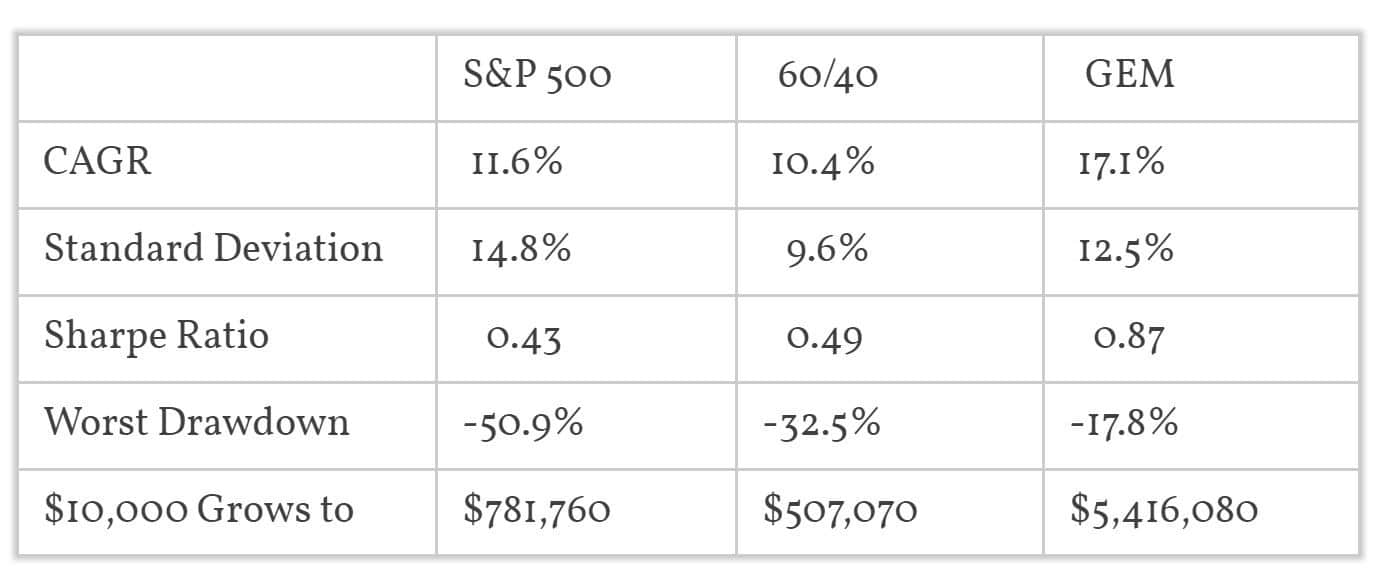
Here is an example showing the performance of the S&P 500 index compared to a balanced portfolio with 60% in the S&P 500 index and 40% in the Barclays Capital U.S. aggregate bond index. The data is from the start of the bond index in January 1976 until November 2016. It represents a possible 40-year holding period of someone saving for retirement.
Results are hypothetical, are NOT an indicator of future results, and do NOT represent returns that any investor actually attained. Indexes are unmanaged, do not reflect management or trading fees, and one cannot invest directly in an index. Please see our Disclaimer page for more information.
Here are the results adding the simple Global Equities Momentum (GEM) model featured in my book and in an earlier blog post. GEM uses relative momentum to switch between U.S. and non-U.S. stock indices, and absolute momentum to switch into aggregate bonds when stocks are weak. GEM’s single parameter, the lookback period, was discovered in 1937. GEM uses a combination of relative and absolute momentum. Both types of momentum have shown good results in over 200 years of back data.[2] The difference in annual returns of 1.2% gives a 54% increase in ending wealth over this 40-year span. In this example, the most desirable portfolio may depend on your own risk tolerance. The 60/40 portfolio has a less painful worst drawdown. Which portfolio would you choose? How difficult would it be for you to live with GEM?
Results are hypothetical, are NOT an indicator of future results, and do NOT represent returns that any investor actually attained. Indexes are unmanaged, do not reflect management or trading fees, and one cannot invest directly in an index. Please see our Disclaimer page for more information.
When I analyze investment opportunities, my primary criteria are a high CAGR combined with a tolerable level of risk exposure. CAGR represents the geometric growth rate of one’s capital.[3] It takes volatility into account. If two strategies have the same average return, the one with lower volatility will have a higher CAGR.
But like the Sharpe ratio, CAGR does not measure tail risk. Extreme downside exposure can cause you to exit positions prematurely screaming in pain or cursing your investment advisor. That is why I also consider drawdowns.
Worst drawdown is only a single point in time, but it can give you a pretty good idea about tail risk. I also examine the distribution of returns and look at rolling windows of drawdowns. Keep in mind that your worst drawdown may lie ahead still. Having a simple, robust approach that performs well over a long period may reduce that risk.
Impatience
It is important to remain focused on what is important – accumulating wealth while protecting yourself from severe bear markets. Once you have a good investment strategy, you need to be patient so it can do its work for you. Warren Buffett said the stock market is a mechanism for transferring wealth from the impatient to the patient. This applies to momentum as well as to other investors.
[1] See Levy (2016).
[2] See Geczy and Samonov (2015).
[3] For econ geeks, CAGR is consistent with logarithmic utility. The Sharpe ratio represents quadratic utility unless returns are normally distributed. See Friedman and Sandow (2004) and Levy (2016).

