
There are many ways to use momentum. Some are better than others. Let us look at some of the best approaches.
Stock Momentum
In 2018, Dimensional Fund Advisors (DFA) issued a report on the performance of all public momentum funds from June 2003 through 2017. Only one fund had outperformed the Russell 3000 broad market benchmark. That fund was the iShares Edge MSCI USA Momentum Factor ETF (MTUM). Its track record dating back to 2013 was shorter than the other funds.
MTUM has continued doing well since 2017. Momentum does best with a limited portfolio of stocks, and MTUM holds only 125 stocks. MTUM’s annual expense ratio of 0.15% is multiples lower than the expense ratios of most of the other momentum finds. MTUM also uses a lower threshold for exiting stocks than it does for buying them. This reduces portfolio turnover and transaction costs.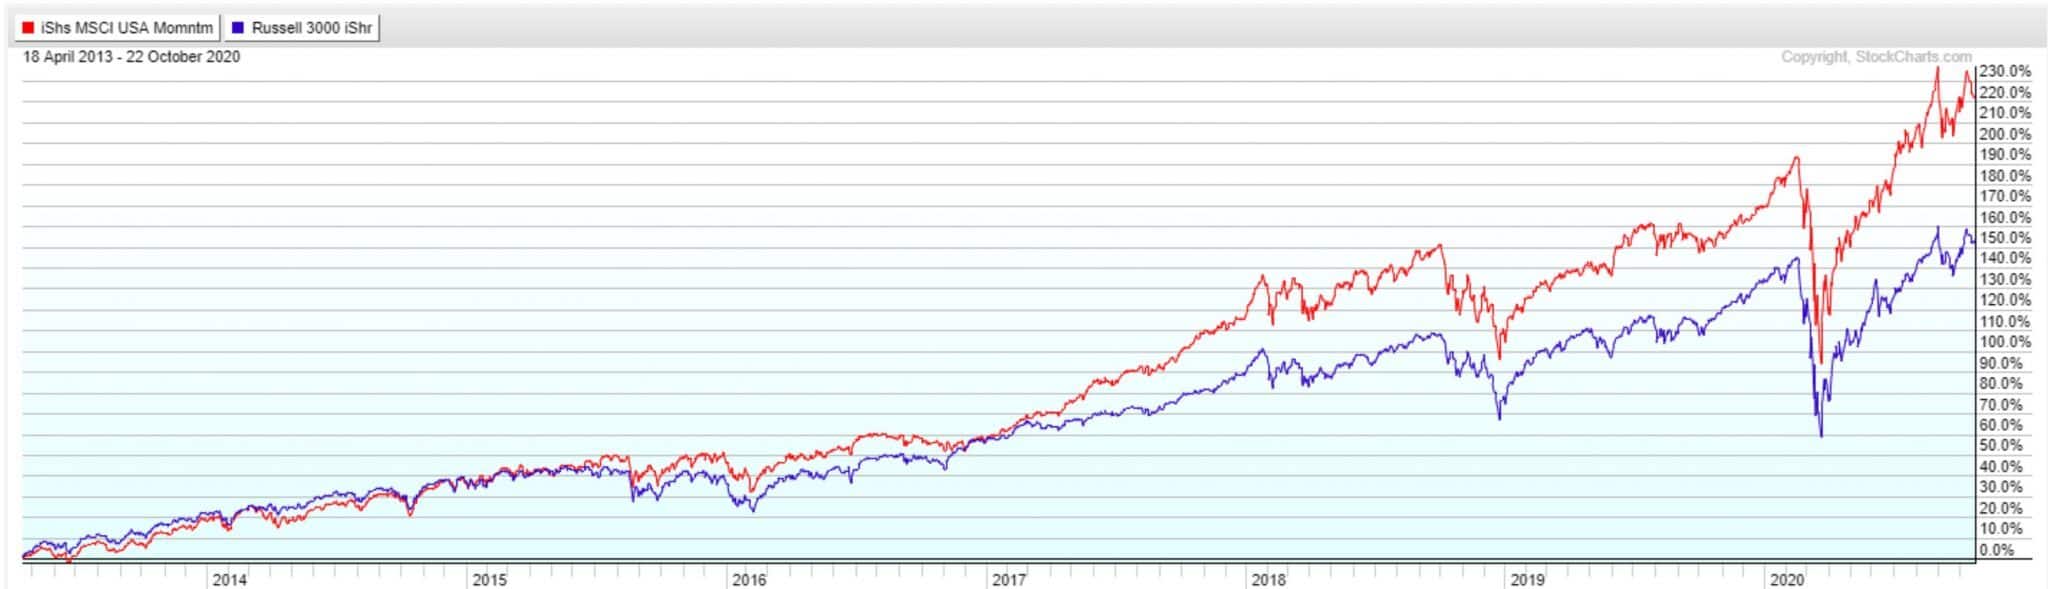
MTUM also strikes a good balance by using two lookback periods of 12 and 6-months. Using several lookback periods helps smooth performance while having many can degrade performance. (We use a few lookback periods in our proprietary momentum models.)
But the main reason MTUM has done well is its reliance on large-cap growth stocks. These have done especially well since MTUM began.
Here is a performance chart of the iShares Russell Top 200 Growth ETF (IWY) versus MTUM. IWY’s performance holding 200 growth stocks was equal to MTUM’s from MTUM’s start until mid-2019. IWY has outperformed MTUM since then.
There has been even more outperformance in NASDAQ growth stocks as seen in the Invesco QQQ Trust.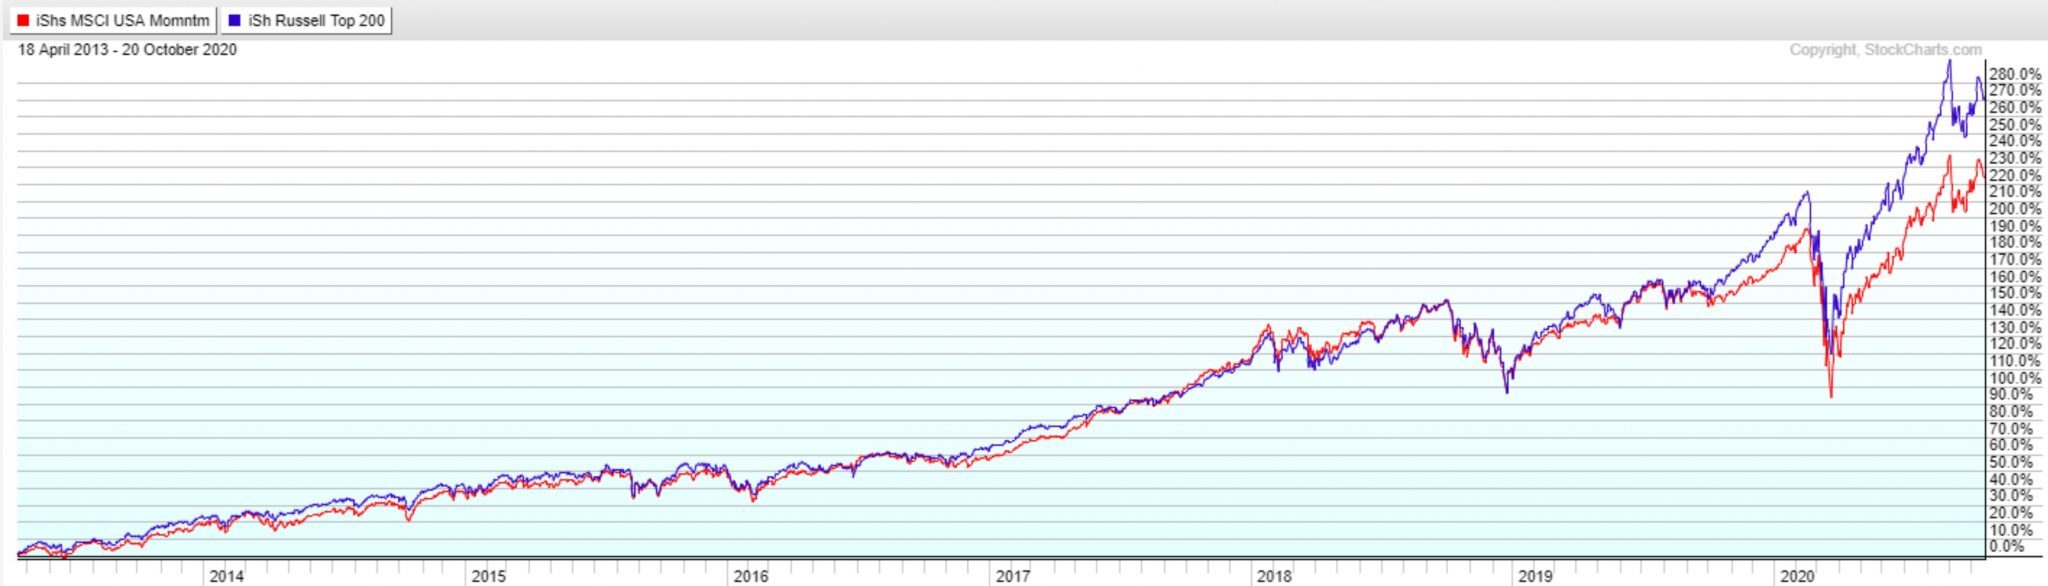
No one knows if MTUM will continue to outperform once growth and technology stocks come back down to earth. MTUM might then perform more in line with other momentum funds that have underperformed the broad market over a longer period.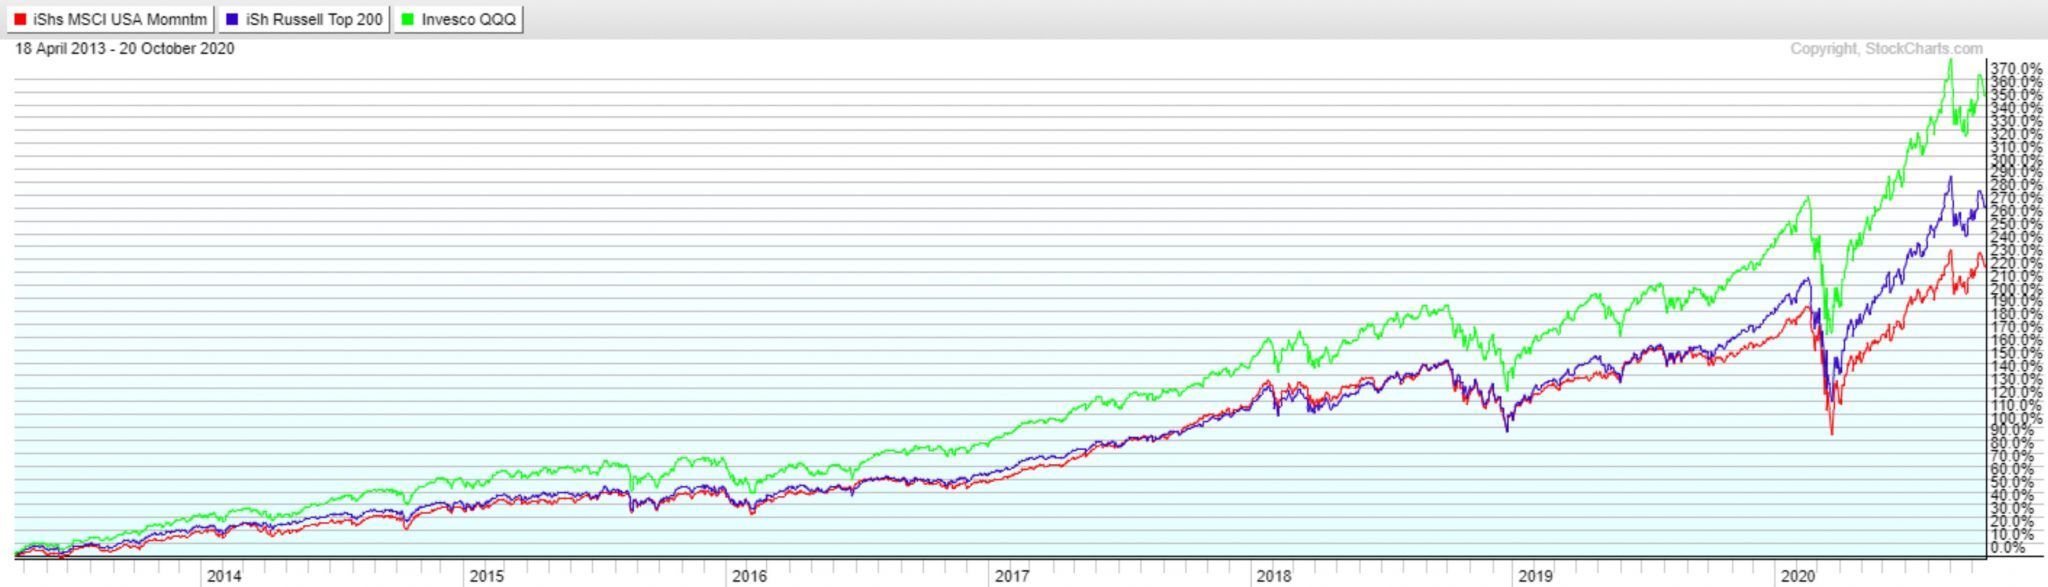
A recent paper by Theisen & Yilanci (2020) called “Momentum? What Momentum?” shows momentum much weaker than previously thought once you adjust for risk at the stock level.
Results become negative in all categories when you further adjust for transaction costs based on bid-ask spreads.
Bond Momentum
Few investors know that momentum works as well with bonds as it does with stocks. There are many bond sectors to choose from based on quality and duration. Bonds also do better using different lookback periods than equities. Because of added complexity and bond sector due diligence, we created a proprietary model called Dual Momentum Fixed Income (DMFI). Here are its results compared to intermediate U.S. Treasury notes and the S&P 500 index.
| June 1970 – Sept 2020 | |||
| DMFI | 10YR TNOTE | S&P 500 | |
| CAGR | 10.3 | 7.2 | 10.7 |
| Standard Deviation | 5.4 | 8.1 | 15.3 |
| Sharpe Ratio | 1.00 | 0.40 | 0.46 |
| Worst Drawdown | -11.3 | -21.0 | -51.0 |
| % of Up Months | 81 | 62 | 63 |
Results are hypothetical, are NOT an indicator of future results, and do NOT represent returns that any investor actually attained. Indexes are unmanaged, do not reflect management or trading fees, and one cannot invest directly in an index. Please see our Disclaimer page for additional disclosures.
DMFI’s return has been comparable to the stock market. Yet its volatility and downside risk has been lower than intermediate-term Treasury notes. We know of no better way to invest in the fixed income market than momentum applied to bond sectors.
Equities Momentum
When I began researching momentum, I focused on equities. This was because stocks have had the highest risk premium among all long-term assets. I then had to decide whether to be in individual stocks, stock sectors, stock styles (size, value, etc.), or stock indices. Diversification was another issue to consider.
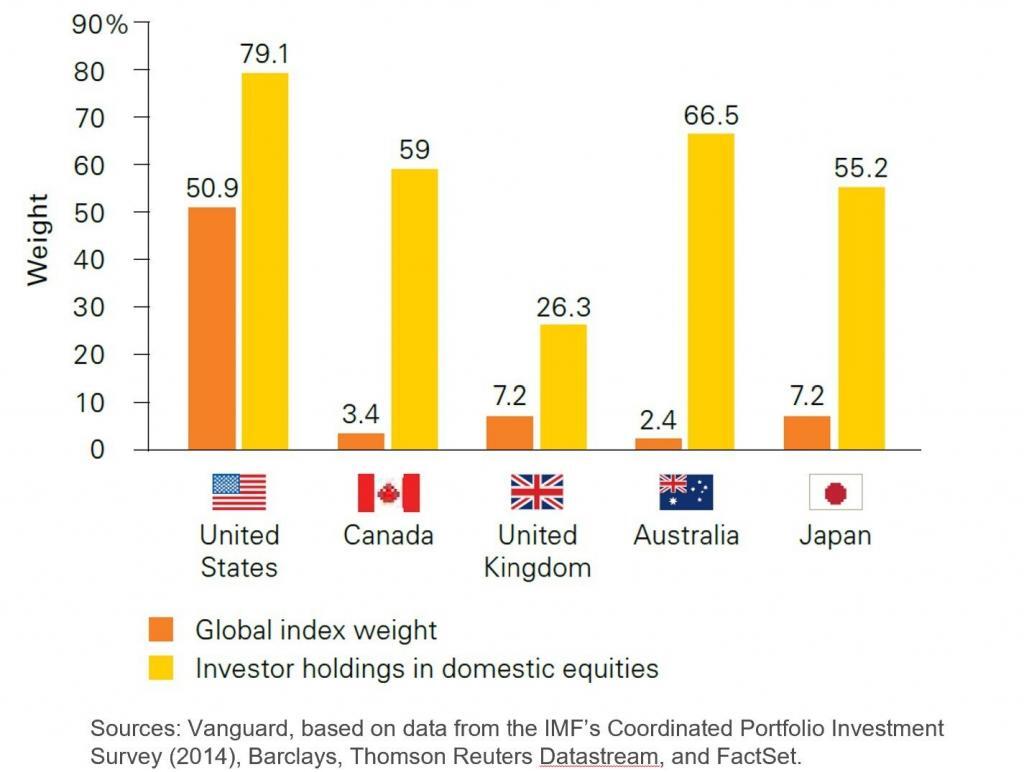
In the 1970s academics began writing about the value of global diversification with equities. Practitioners soon began diversifying globally. Today U.S. investors hold about 20% of their equity portfolios in non-U.S. stocks.
But global stock diversification may not be as helpful as academic researchers once thought. Here is a chart from Page and Panierello’s (2018) “When Diversification Fails”.
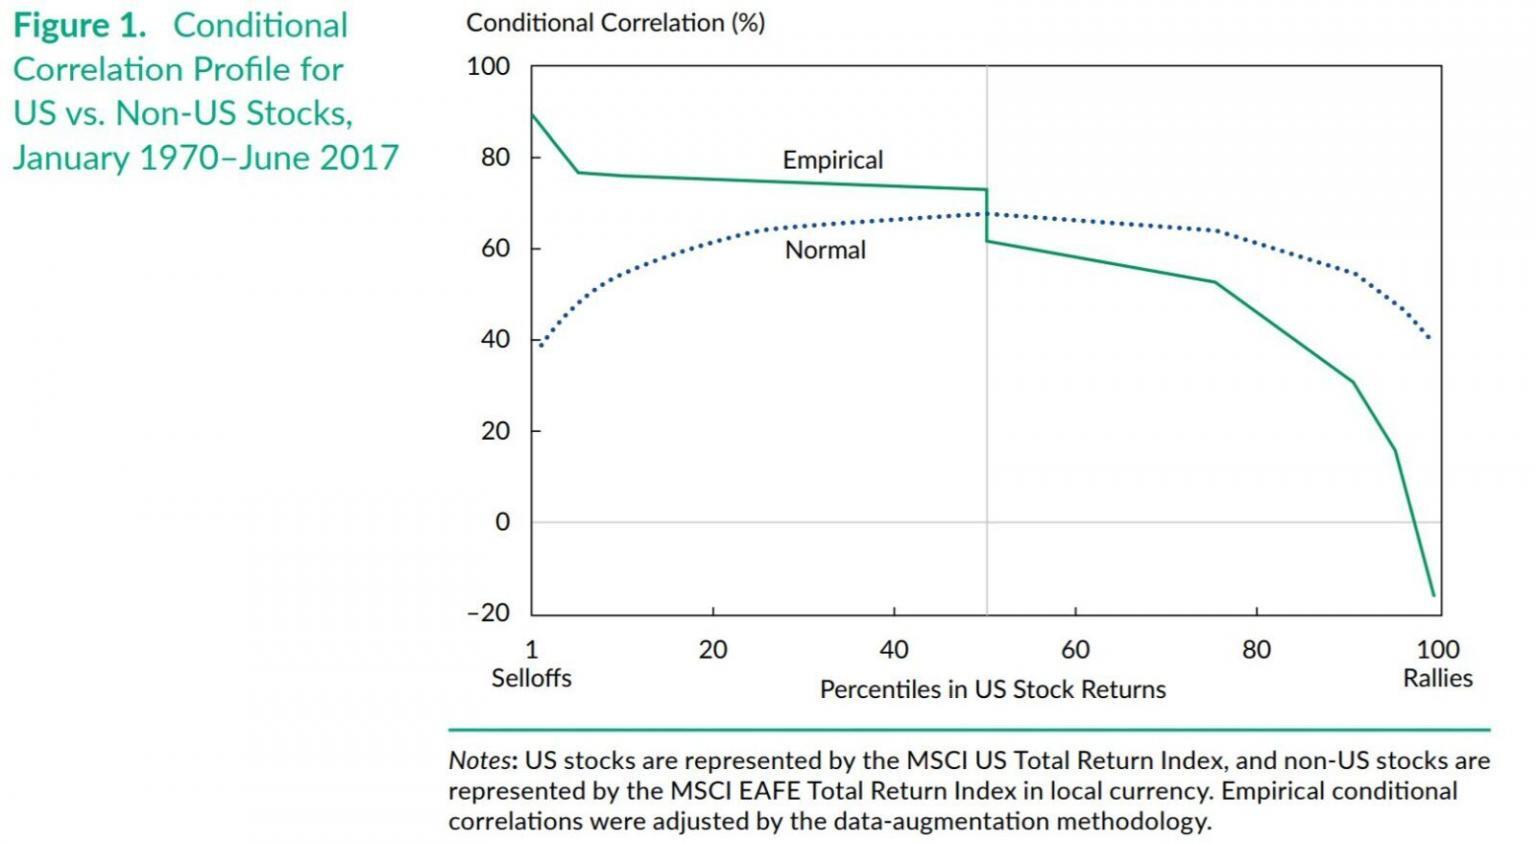
The correlation between U.S. and non-U.S. stocks should be around 40% to 65% depending on market conditions. But in practice, results have been very different. When U.S. stocks rally strongly, their correlation with non-U.S. stocks has been negative. This creates a drag on portfolio performance.
When U.S. stocks sell off sharply, the correlation between U.S. and non-U.S. stocks rises to around 90%. Investors shy away from all equities during times of severe market stress. Diversification into non-U.S. stocks does little good then when needed the most.
What about diversifying by using relative momentum? My 2011 research paper compared relative momentum applied to individual stocks, stock sectors, stock styles, and country indices. Results were best with global stock indices.
In 2015, Geczy & Samonov (2015) looked at momentum applied to country indices, individual U.S. stocks, stock sectors, currencies, government bonds, and commodities. They used data back to 1801. Best results were again with globally diversified stock indices.
There are about 50 country stock indices with investable ETFs. To apply momentum you would need to know how many indices to use, which ones they should be, and how to weight them. Should the U.S., which makes up half the world’s market capitalization, have the same weighting as countries with smaller market capitalizations?
One solution is to use only two assets – the S&P 500 representing U.S. stocks and the MSCI All Country World Index ex- U.S. (or the Global Financial Data equivalent) for the rest of the world. These match their global market capitalizations.
We look at the relative performance of these two indices over the past 12-months to determine which of the two to invest in the following month. A 12-month lookback period is well-supported in academic research. It also keeps transaction costs low with less than one trade per year on average. There is also little tracking error since we are always invested in correlated stock indices. The strategy invests in the S&P 500 56% of the time and the MSCI ACWI ex-U.S. index 44% of the time.
Here is the performance of this strategy versus the S&P 500 and the MSCI ACWI index (or GFD equivalent) that includes both U.S. and non-U.S. stocks:
| Jan 1950 – Sept 2020 | |||
| RS Mom | S&P 500 | ACWI | |
| CAGR | 13.3 | 11.4 | 11.4 |
| Standard Deviation | 14.6 | 14.4 | 13.7 |
| Sharpe Ratio | 0.64 | 0.53 | 0.40 |
| Worst Drawdown | -54.6 | -51.0 | -60.2 |
| % of Up Months | 67 | 66 | 66 |
Results are hypothetical, are NOT an indicator of future results, and do NOT represent returns that any investor actually attained. Indexes are unmanaged, do not reflect management or trading fees, and one cannot invest directly in an index. Please see our Disclaimer page for additional disclosures.
The volatility and downside exposure of RS Mom is about the same as the S&P 500. But the relative momentum strategy earns an average of 190 basis points (bps) more per year than either the S&P 500 or the MSCI ACWI index. The drawdown of the ACWI portfolio was worse than either the RS Mom portfolio or the S&P 500. This is in line with Page & Panierello’s study that found no reduction in worst-case drawdowns when combining U.S. with international equities.
Most money managers would be happy to have earned 190 bps more per year than the S&P 500 over the past 70 years. Yet I know of no one who uses this simple strategy. Why is that?
First is the simplicity of this approach. Many think more complex models with more assets, factors, or lookback periods should give better results. Complexity bias causes them to ignore Einstein’s advice to keep things as simple as possible, but no simpler.
Second is familiarity bias. Most known momentum research looks at individual stocks rather than stock indices. Even fewer are familiar with the research by me or Geczy & Samonov showing that momentum works best with global stock indices.
Finally, there is strong and universal home country bias.
U.S. investors are reluctant to shift all their equity assets into non-U.S. stocks when momentum calls for it. This keeps non-U.S. stocks from initially reaching their true value. Non-U.S. investors have the same bias against moving entirely into U.S. stocks when it would be best to do so according to relative momentum. The behavioral theory of why momentum works say profits come when assets eventually go strongly from undervalued to fair or overvalued.
Like other behavioral biases, home country bias is unlikely to disappear. The odds are good of continuing momentum profits for those who can overcome home country, familiarity, and complexity biases. Instead, you should exploit these biases in others.
Equities Dual Momentum
Relative momentum applied to global stock indices is a good way to enhance expected returns for buy-and-hold investors. But it does not offer a downside protection advantage over traditional buy-and-hold investing. In my 2011 momentum paper, I came up with a type of momentum that attempts to mitigate downside risk. I did this by using short or intermediate-term U.S. Treasury notes as an alternative to equities when notes were performing better. This is the basis behind absolute momentum, sometimes called time-series momentum. At the cost of some tracking error and whipsaws, absolute momentum has shown an ability to protect investors from extreme losses during bear markets.
In 2012, Moskowitz, Ooi, and Pedersen in their paper “Time Series Momentum” applied TSM to 58 equity index, currency, commodity, and bond futures. Hurst, Ooi, & Pedersen (2017) extended TSM back to the year 1880. Greyserman and Kaminski (2014) showed that trend-following momentum outperformed buy-and-hold over the past 800 years.
In my 2012 paper, “Risk Premia Harvesting Through Dual Momentum”, I introduced the concept of dual momentum that uses both relative and absolute momentum together. There is more about dual momentum here, here, and in my book, Dual Momentum Investing: An Innovative Strategy for Higher Returns with Lower Risk.
Every month the Performance page of my website updates the performance of our dual momentum models. Here is also some information about the proprietary models we license to advisors and family offices. We spent years developing those adaptive models. They use all momentum tools available to us in pursuit of high and consistent returns.