Several months ago we posted an article called “Bring Data” where we showed the importance of having abundant data for system development and validation. This was further reinforced to us recently when someone brought us additional U.S. stock sector data. Previously, we only had Morningstar sector data that went back to 1992, which we used to construct our Dual Momentum Sector Rotation (DMSR) model. (S&P sector data goes back to only the early 1990s.) This is the amount of data that most sector rotation programs use to backtest their strategies.
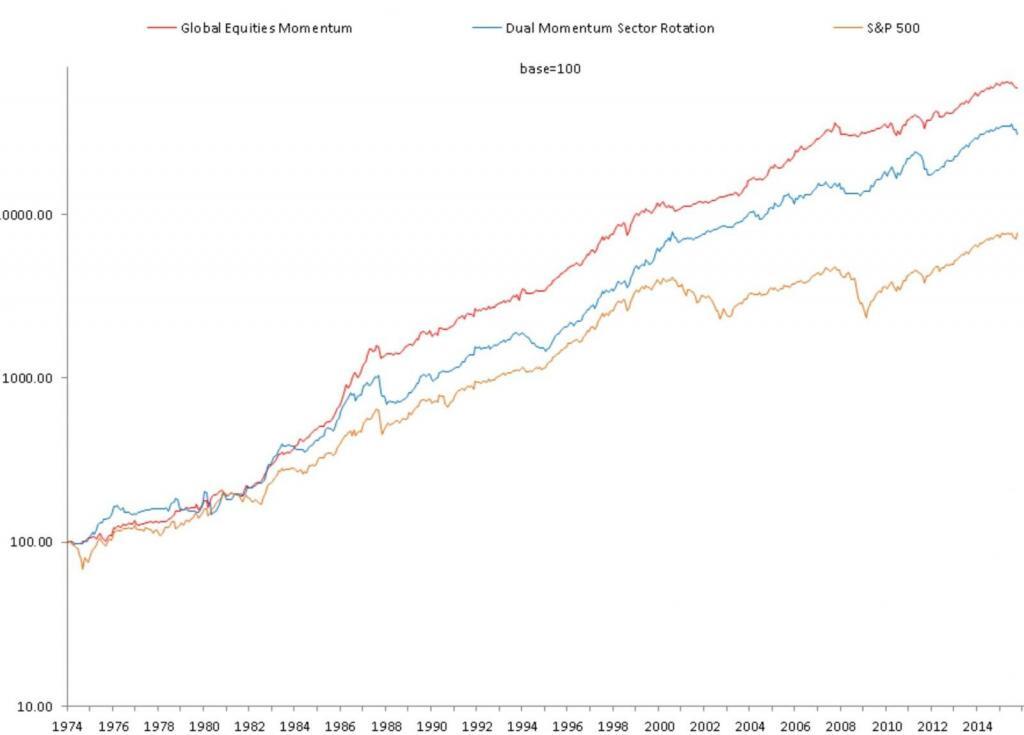
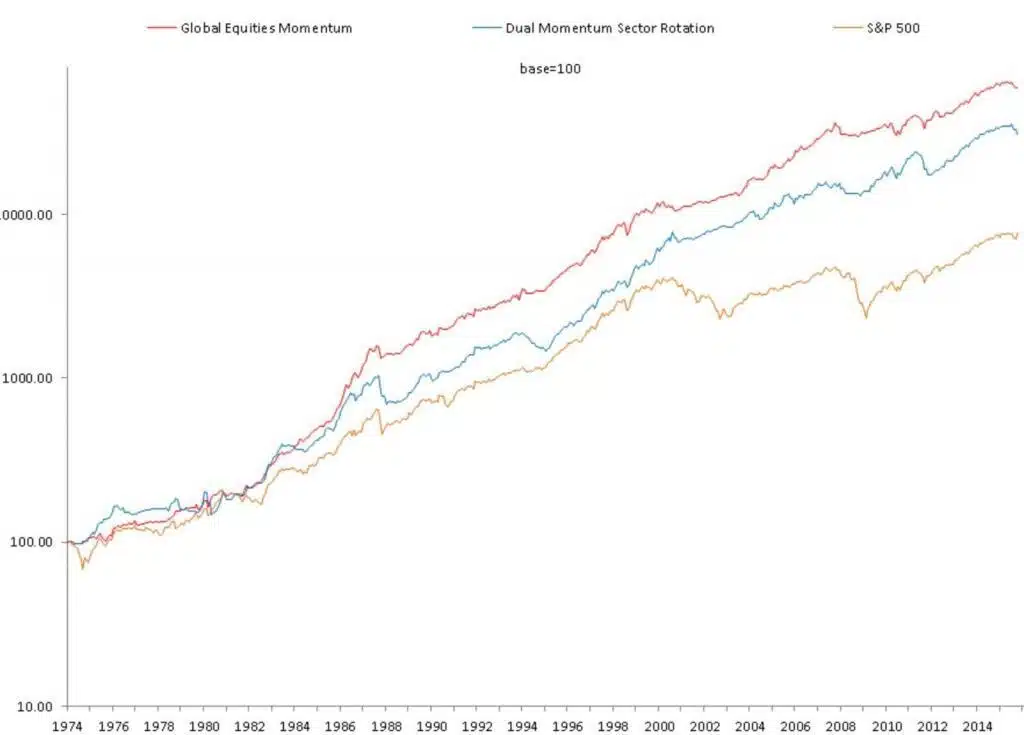
When we were given equivalent Thompson Reuters U.S. stock sector data back to 1973, we immediately extended our DMSR backtest to include this additional data. After incorporating the new data, DMSR still looked more attractive than buying and holding the S&P 500 index. But one could argue that the performance of our dual momentum models using broad-based equity indexes, such as Global Equities Momentum (GEM), now look better than DMSR. Here are the comparative performance figures from January 1974 through October 2015:
Results are hypothetical, are NOT an indicator of future results, and do NOT represent returns that any investor actually attained. Indexes are unmanaged, do not reflect management or trading fees, and one cannot invest directly in an index.
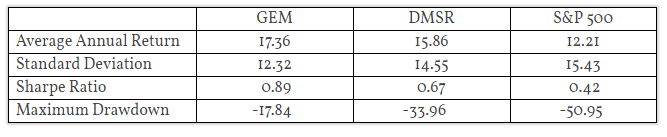
Because the monthly correlation between GEM and DMSR is only 0.59, sector rotation may still have a modest role to play in a diversified equities-oriented portfolio. But DMSR is not the best choice as a core portfolio holding. Sector rotation programs that use data no further back than the early 1990s to develop their models may be in for a rude awakening someday. Future drawdowns may be higher and returns may be lower than expected.
Along the same lines, there are also momentum-based portfolios popping up on the internet all the time now, some even labeled as “dual momentum,” modeled on the basis of only 10 or 15 years of ETF data. Momentum may be robust enough that future results won’t suffer much because of this. But those who think they are constructing optimal models this way are just fooling themselves. Overfitting modest amounts of data is one of the most pernicious problems in the development of investment models. Those who do this may argue that the markets change over time, so the best model parameters from years ago may not be as relevant as today’s best parameters. This may be true. However, what is also true is that today’s parameter values are also likely to be sub-optimal when moving forward in time. The following chart from my book, Dual Momentum Investing, shows what I mean:
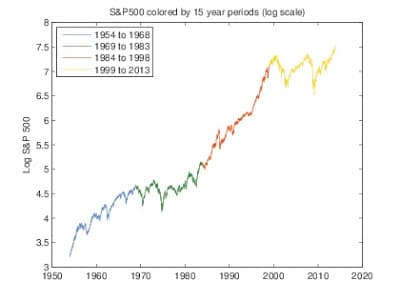
The S&P 500 is highlighted in different colors for each 15 year period. You can see that the latest period, 1999-2013, looks different from the preceding period, 1984-1998. 1999-2013, in fact, looks more like the earlier 1969-1983 period. 1984-1998 is also different from its preceding period, 1969-1983 and similar to the earlier years 1954-1968. If you had used each 15-year period to develop your model, you would have had something unsuited for each of the next 15-year periods. You would have been better off using all four periods to formulate a model rather than just the last 15-year period. The more data you use, the more likely you are to have a robust model that will hold up reasonably well in the future, even though it isn’t the best fit for any one particular period.
The 12-month lookback parameter we use for our GEM dual momentum model was found to work well in 1937 by Cowles & Jones. It has been used extensively in momentum research since then and has held up well out-of-sample. But there is a lot more history than that to help give us more confidence in momentum. Let’s take a look at some of that now.
We focus on stocks as our core asset since they have historically offered the highest risk premium to investors. U.S. stocks, in particular, have given investors the best long-run returns. Other assets can create a drag on long-run portfolio performance. They also lose some importance as diversifiers once you use a trend-following overlay like absolute momentum to help attenuate your downside risk exposure.
The longest backtest on stock market momentum is by Geczy and Samonov (G&S). Their 2013 paper called “212 Years of Price Momentum: The World’s Longest Back Test 1801-2012” compared the top one-third to the bottom one-third of U.S. stocks sorted monthly by relative momentum. Over this entire sample period, the top equally weighted momentum stocks outperformed the bottom ones by 0.4% per month with a highly significant t-stat of 5.7. Prior to this study, momentum outperformance on U.S. stocks had been found significant back to 1926. G&S showed that stock momentum was also positive and statistically significant from 1801 to 1926.
G&S also found that stock market momentum was remarkably consistent. In only 2 of the 21 decades from 1801 through 2012 did long-only momentum underperform buy-and-hold, and these were by just -1.2% and -0.7% annually. In all the other 19 decades, momentum outperformed buy-and-hold by an average of 3.8% annually.
This year G&S came out with a new study called, “215 Years of Global Multi-Asset Momentum: 1800-2014: Equities, Sectors, Currencies, Bonds, Commodities, and Stocks.” Here G&S expanded its momentum study to cover six different asset classes, including bonds, stock sectors, and equity indices, which are the ones we use in our momentum models. [1] G&S demonstrated the outperformance of momentum inside and across all asset classes except commodities. Here is a chart from their paper showing the log cumulative equally-weighted average of the 6 asset classes plus the cross-asset momentum excess returns.
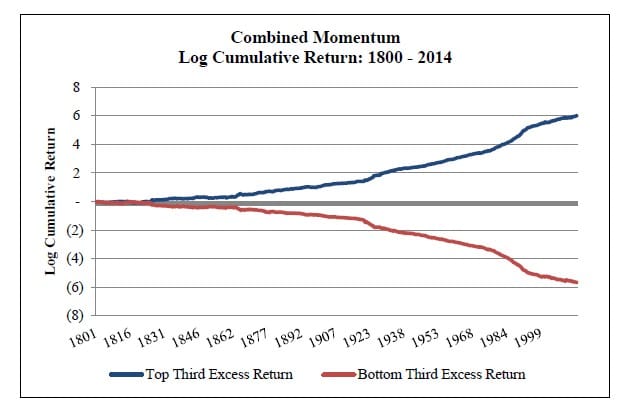
The strongest momentum effect is in geographically diversified equity indices, which had a long-only monthly excess return over buy-and-hold of 0.52% with a highly significant t-stat of 11.7, compared to 0.29% with a t-stat of 6.4 for individual U.S. stocks before transaction costs, which would be much higher for stocks. Country equity indices outperform global equity sectors, which is consistent with our updated findings. G&S also shows that long-only absolute (time series) momentum outperformed buy-and-hold by 0.15% per month with a t-stat of 11.2.
For those who want to further their momentum education, I suggest you read the seminal paper by Jegadeesh and Titman (1993) that started the modern momentum renaissance. Next, learn about absolute momentum from Moskowitz et al (2012) or Antonacci (2013). Then follow up with Geczy and Samonov (2015) to satisfy yourself as to the efficacy and robustness of momentum investing based on 215 years of empirical evidence.
[1] Equity indexes are equally as good as individual stocks (or better, according to G&S) in capturing the momentum effect. Indexes are much easier to use, avoid the enormously high transaction costs associated with rebalancing momentum-based stock portfolios, and are much less susceptible to scalability issues. They are still subject though to high short-term volatility and significant periods of benchmark underperformance.