From the time my book was published others have tried to improve upon the book’s Global Equity Momentum (GEM) model. There is nothing wrong with trying to improve on someone’s work. That is how progress is made.
But if not careful, such attempts can have data mining, overfitting, and selection bias issues. Data mining is when you search through data to develop or optimize a model. Such models often do not hold up well going forward especially if you have a limited amount of testing data. Before the advent of computer power, researchers would formulate hypotheses before crunching the numbers. Now anyone can design models that rely primarily on data mining. This is especially true of machine learning algorithms. If you torture the data long enough, it will tell you what you want to know.
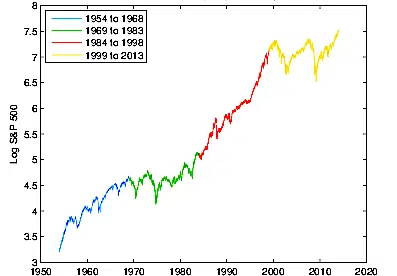
Some develop quant models by data mining 15 to 20 years of ETF data which is as far back as that data will let you go. Here is a chart from my book showing how regimes change considerably every 15 years.
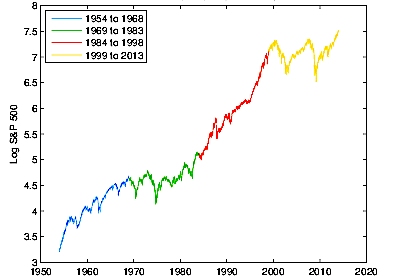
Searching for factors or parameter values based on only 15 or 20 years of data is likely to give disappointing results going forward when regimes change. Even 40 years of data may not be enough to inspire real confidence.
Model overfitting can happen with complex models. John von Neumann said, “With four parameters I can fit an elephant and with five I can make him wiggle his trunk.” In investing, simplicity is a virtue.
Selection bias is when you know what your testing results are likely to be ahead of time and build a model that consciously or unconsciously incorporates that information. You might select data or your data starting point knowing it will give good results while ignoring other possibilities.
Here is an example of selection bias. An advisory firm invited me to dinner to discuss licensing my proprietary models. I thought it odd since they already had their own momentum-based models. At dinner, I asked them why their published results only went back 13 years when there was more data available. They said it was because investors do not like to see drawdowns greater than 20%!
Selection bias, model overfitting, and data mining issues may not be obvious or intentional. Here is what to do to avoid these problems.
Use lots of data
Our first GEM backtest began in 1974. We were constrained by the amount of bond data that we had then. When I acquired more bond data, we extended our backtest to 1971 where we were now limited by the amount of MSCI non-U.S. stock index data. The extra 3 years of performance gave us an out-of-sample period covering the 1973-74 bear market. GEM performed well out-of-sample by being out of stocks during most of the bear market.
We recently gained access to non-MSCI stock index data and were able to extend our GEM backtest to Jan 1950. Asness, Israelov, and Liew (2017) in “International Diversification Works (Eventually)” also used 1950 as a starting date for their study. During World War II almost no one invested globally. Capital controls made it impossible to purchase equities in hostile countries, The Templeton Growth Fund which began in 1954 was the first international fund available to U.S. investors.
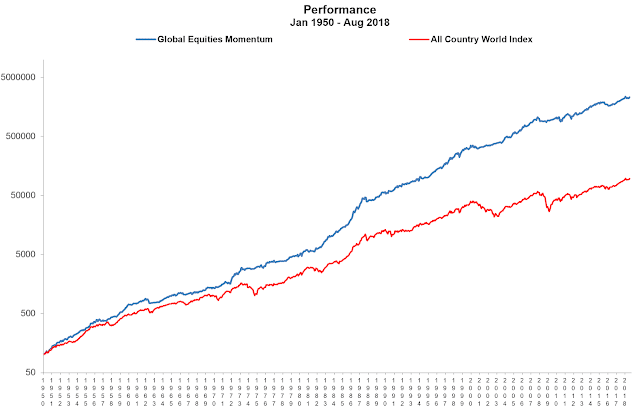
Historical data and analysis should not be taken as an indication or guarantee of any future performance. Future performance of GEM may differ significantly from historical performance. Please see our Disclaimer page for additional disclosures.
It is encouraging that GEM continued to outperform during the 1950s and 1960s. See the Performance page of our website for more details.
Respect prior studies and well-established ideas
Researchers have studied long-short momentum more than any factor in finance. Geczy and Samonov (2017) looked at momentum applied to geographically diversified stock indices, bonds, currencies, commodities, stock sectors, and U.S. stocks back to 1801. Momentum outperformed buy-and-hold in all these areas. The best results were with global stock indices shown below as “Equity”. These are what we use with momentum. One reason these do best may be home country bias. Investors prefer to invest in their own country’s equities and fail to take full advantage of opportunities outside their own borders.
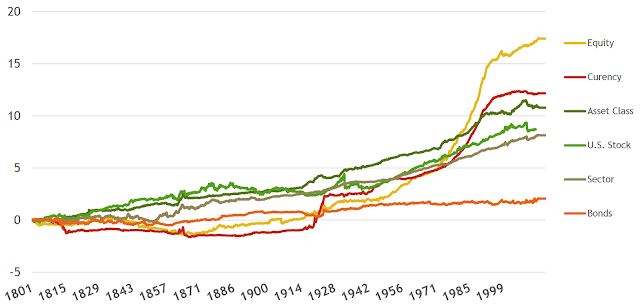
Source: Geczy & Samonov (2017), “Two Centuries of Multi-Asset Momentum (Equities, Bonds, Currencies, Commodites, Sectors, and Stocks”
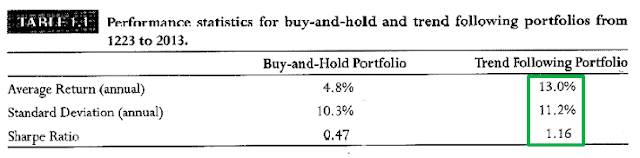
We use a 12-month momentum lookback that Cowles & Jones found worked well back in 1937. Jegadeesh & Titman did also in their seminal momentum research done in the 1990s. A 12-month momentum lookback soundly beat buy-and-hold from the beginning of stock market trading in the 1600s and with other assets back to 1223 as reported by Greyserman & Kaminski (2014).
Keep things simple
We prefer to be holding stocks as much as we can since they have the most proven risk premium. We keep things simple by being in U.S. or non-U.S. stock indices according to their relative strength over the preceding 12 months. For non-U.S. stocks, we avoid selection bias by being in as broad an index as possible. That is the MSCI All Country World Index ex-U.S (ACWI ex-US). It includes all non-U.S. MSCI developed and emerging countries weighted by their market capitalization. When the trend in stocks is negative according to 12-month absolute momentum, we exit stocks for the safety of aggregate bonds. We always try to follow Einstein’s advice of keeping things as simple as possible but no simpler. Let us look instead now at variations of dual momentum appearing on the internet.
Shorter lookback periods
In my book, I show that a 12-month lookback period outperformed 3, 6, and 9-month lookback periods with GEM. This lookback period has held up well since it was first identified by Cowles & Jones in 1937. My website’s FAQ page describes in more detail the advantages of a 12-month lookback.
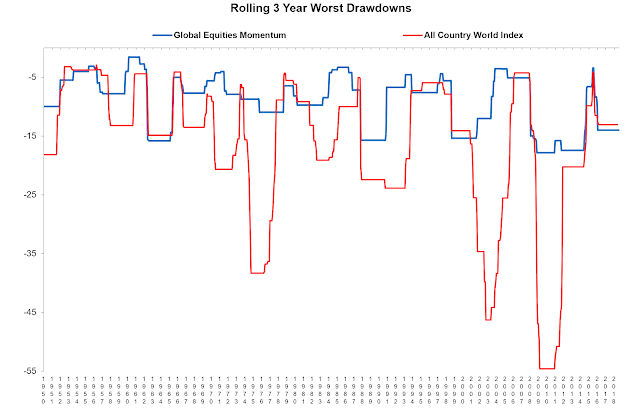
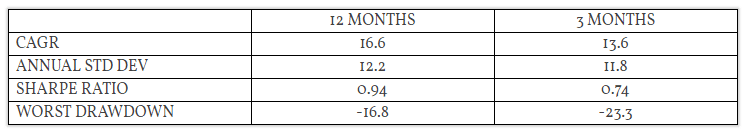
A 3-month look-back has done well over the past 20 years. If you were to look only at that data, you might feel reassured about using a shorter lookback period. But this starts to unravel in 1979-80 when the markets were choppy. Choppiness gives lower returns and higher drawdowns. Here are GEM results from Jan 1971 through Aug 2018 comparing 12 and 3-month lookback periods.
Results are hypothetical, are NOT an indicator of future results, and do NOT represent returns that any investor actually attained. Indexes are unmanaged, do not reflect management or trading fees, and one cannot invest directly in an index.
There are also tax advantages to a 12-month look back. Using 12 months, GEM trades on average 1.3 times per year. Seventy percent of GEM’s gains are long-term, while 100% of its losses are short-term. These tax advantages disappear if you use a shorter lookback period.
Using a 12-month lookback also reduces data mining concerns and seasonality bias. One may wish to incorporate shorter lookback periods for diversification purposes, but it does not make sense to discard longer ones when doing so.
EAFE instead of ACWI ex-U.S.
There are websites that show dual momentum results and issue signals using the MSCI EAFE index rather than the broader MSCI ACWI ex-U.S. index. They may think there is little or no difference between the two. But emerging markets and Canada missing from the MSCI EAFE make up a significant 24% of the MSCI ACWI ex-US index. Using the broader MSCI ACWI ex-U.S. avoids selection bias by being all-inclusive.
Here are the GEM results using each index since January 1989. The MSCI ACWI ex-U.S. index was introduced in December 1987, and 12 months is needed for initialization.
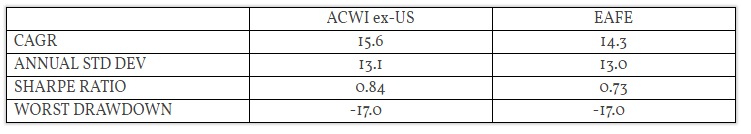
Results are hypothetical, are NOT an indicator of future results, and do NOT represent returns that any investor actually attained. Indexes are unmanaged, do not reflect management or trading fees, and one cannot invest directly in an index.
GEM earned 130 basis points more in annual return using the MSCI ACWI ex-U.S. rather than the MSCI EAFE index holding all else constant. MSCI ex-U.S. is more volatile than MSCI EAFE. Much of this outperformance was due to momentum capturing the upside volatility and avoiding the downside volatility of MSCI ACWI ex-U.S. MSCI ex-U.S. also signaled some earlier entries into stronger non-U.S. stocks. It is misleading to say that there is little difference in performance by looking back to 1970 or earlier since MSCI didn’t track emerging markets before 1988.
Broader indices
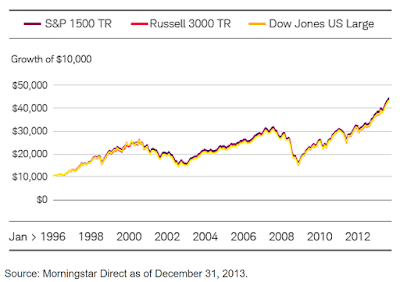
Some think using the total U.S. stock market should do better than the S&P 500 since broader indices include small and midcap stocks. We can easily check that out. The total U.S. stock indices have performed similarly to one another. I will use the Russell 3000 since it has the longest price history.
Here are GEM results comparing the use of the S&P 500 versus the Russell 3000 from when the Russell 3000 began trading in January 1979.
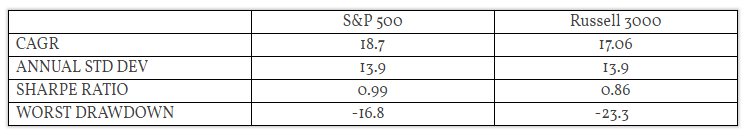
Results are hypothetical, are NOT an indicator of future results, and do NOT represent returns that any investor actually attained. Indexes are unmanaged, do not reflect management or trading fees, and one cannot invest directly in an index.
The reason broader indices give worse results may be due to there not being a small-cap premium despite many who think otherwise. See here and here for more on this.
Long term bonds
Some prefer to use long-term Treasury bonds as a safe harbor when they exit stocks because stocks and bonds have been negatively correlated. They think they will thus earn better returns being in long-duration bonds when stocks are weak.
It is true that stocks and bonds have been negatively correlated in recent years. But that has not always been the case. In fact, stock-bond correlations are as likely to be positive as negative over the long run.
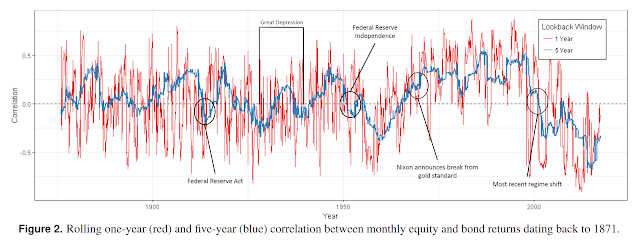
Source: “Equity-Bond Correlation: A Historical Perspective”, Graham Capital Management Research Note, September 2017
Long-term bonds have had similar long-run returns to intermediate bonds despite their higher volatility. The return on intermediate bonds includes compensation for reinvestment risk once these bonds mature. Long bonds do not have this reinvestment risk and do not require a risk premium for it. Therefore, their relative return suffers.
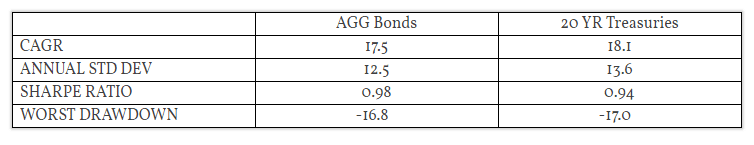
Here are GEM results with the Barclays U.S. Aggregate bond index versus the Barclays 20-Year Treasury bond index from when both became available in January 1976.
Results are hypothetical, are NOT an indicator of future results, and do NOT represent returns that any investor actually attained. Indexes are unmanaged, do not reflect management or trading fees, and one cannot invest directly in an index.
On a risk-adjusted basis, 20-year Treasuries did not outperform intermediate-term aggregate bonds despite low stock-bond correlations and a strong bull market in bonds over the past 35 years. Under normal market conditions, long-term bonds with higher risk are more likely to be at a disadvantage as a safe harbor asset.
Recent data mining example
I have gotten some emails asking about a strategy called “Accelerating Dual Momentum” that was inspired by GEM. This model looks at 20 years of mutual fund data. Based on that data, the developer uses long-term Treasury bonds as his safe harbor asset and a combination of short (1, 3, and 6 months) lookback periods. We have seen that these lookbacks may not be the best choices based on long-term data. They certainly should not be used exclusively. We also know that intermediate-term bonds outperformed long-term Treasury bonds over a longer period. Using a combination of shorter lookback periods is not accelerating dual momentum. It is dual momentum with shorter lookback periods.
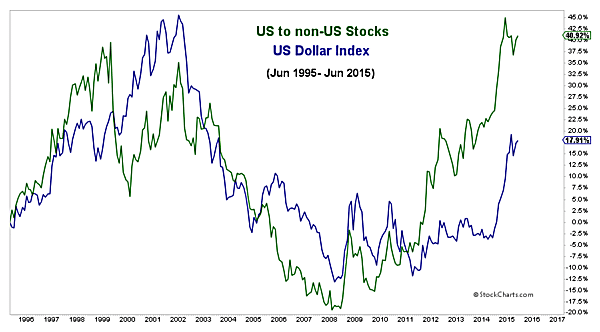
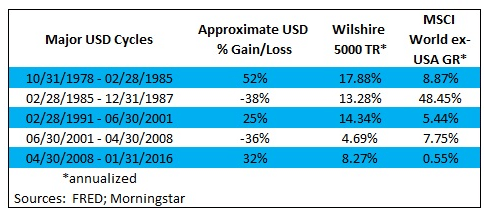
The developer also questions using the MSCI ACWI ex-U.S. index of large and mid-cap stocks as the best vehicle for non-U.S. equities. His argument is that companies are more globalized now so the correlation between U.S. and non-U.S. companies is higher than it once was. This may be true. But the following chart from my website’s FAQ page shows something else. The relative strength difference between U.S. and non-U.S. equities is largely due to macro-economic conditions reflected in the strength or weakness of the U.S. dollar.
The developer’s solution to what he perceives as a correlation problem is to use a small to midcap international stock fund in place of a large-cap international fund.
The starting date of the small to midcap MSCI ACWI ex-U.S. index is May 1994. Its monthly correlation to the S&P 500 is 0.72, which is only modestly lower than the correlation of 0.82 between the regular MSCI ACWI ex-US and the S&P 500. There is not enough history to make a good assessment of future performance. We also know that small-cap international stocks, in general, do not show a statistically significant size premium as noted here.
The ACWI small to midcap ex-U.S. index fund began in 2009. So in place of an index fund, the developer uses an actively managed small to midcap international fund. Looking at a large universe of funds, one can usually find after the fact a few actively managed funds that have outperformed similar index funds. But there is a problem with that approach. Fund performance may be persistent over the short run due to momentum. But over the long run, there is no meaningful relationship between past and future fund performance. See here for more on this.
At the end of his discussion, the developer presented a chart showing the rolling real return of GEM versus his model back to 1871. But prior to 1970, he did not use international stocks. There was thus no dual momentum. He had only absolute momentum with the S&P 500 and government bonds (10-year bonds after 1953 and longer-term government bonds prior to that). He used bond yields and not their total return. He further misrepresented GEM by using EAFE instead of ACWI ex-US when he used international stocks from 1970 forward. We saw earlier that the narrower EAFE index understates GEM performance by 130 bps annually from when ACWI ex-US was introduced in late 1988. Selection bias like we have here is where you use a subset of your data to make your results look better or, in this case, worse than they really are.
Even after his data-mining efforts and distortions of GEM and dual momentum, the developer shows that the trailing 30-year annualized real returns of both models since the mid-1990s were about the same. Rather than trying to manipulate limited amounts of data, others might do better by keeping in mind the simple principles and behavioral biases that have made dual momentum successful.