
Momentum is one of the most researched topics in financial market literature. A search of the SSRN database on momentum will turn up 1000 papers written over the past three years and 3000 papers in total.
With so much information available, it is not surprising that many analysts have missed seeing some of the research. Their views of momentum reflect this fact. Based on the way momentum is generally used, it is clear there are some misconceptions about it. Here is my discussion of some of the more serious ones.
1) “Momentum is best used with individual stocks.”
Initial academic research on momentum by Jegadeesh and Titman (1993), Asness (1994), and others focused on U.S. stocks. This explains why momentum was initially associated with stock investing.
But to see if momentum was robust researchers soon applied it to other markets. Momentum was found to be effective not only with U.S. stocks. It also performed well with international stocks, industry groups, stock indices, bonds, real estate, commodities, and currencies.
When I started to do my own momentum research in 2010, I wanted to study it from a practical point of view. My goal was to determine how one might best use it. I applied momentum to U.S. stocks, industry and style groups, and world regional stock indices. In 2011, I wrote my first momentum paper called “Global Momentum: A Global Cross Asset Approach.” It showed that momentum worked best with regional stock indices.
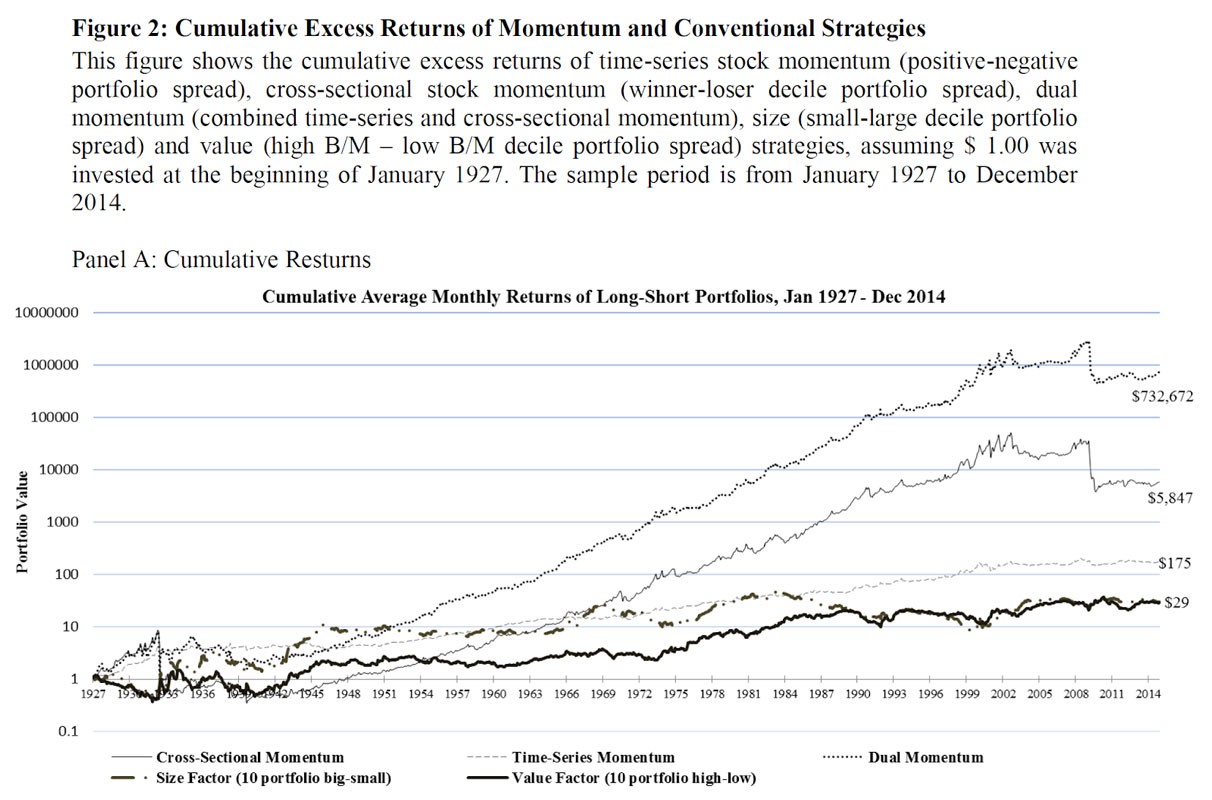
In 2015, Geczy and Samonov did a more comprehensive study called “Two Centuries of Multi-Asset Momentum (Equities, Bonds, Currencies, Commodities, Sectors, and Stocks).” They looked at momentum using country equity indices, government bonds, currencies, commodities, sectors, and U.S. stocks back to 1801. Momentum gave significantly positive results versus buy-and-hold in all areas. But they found momentum worked best with geographically diversified stock indices, represented as Equity in the chart below.
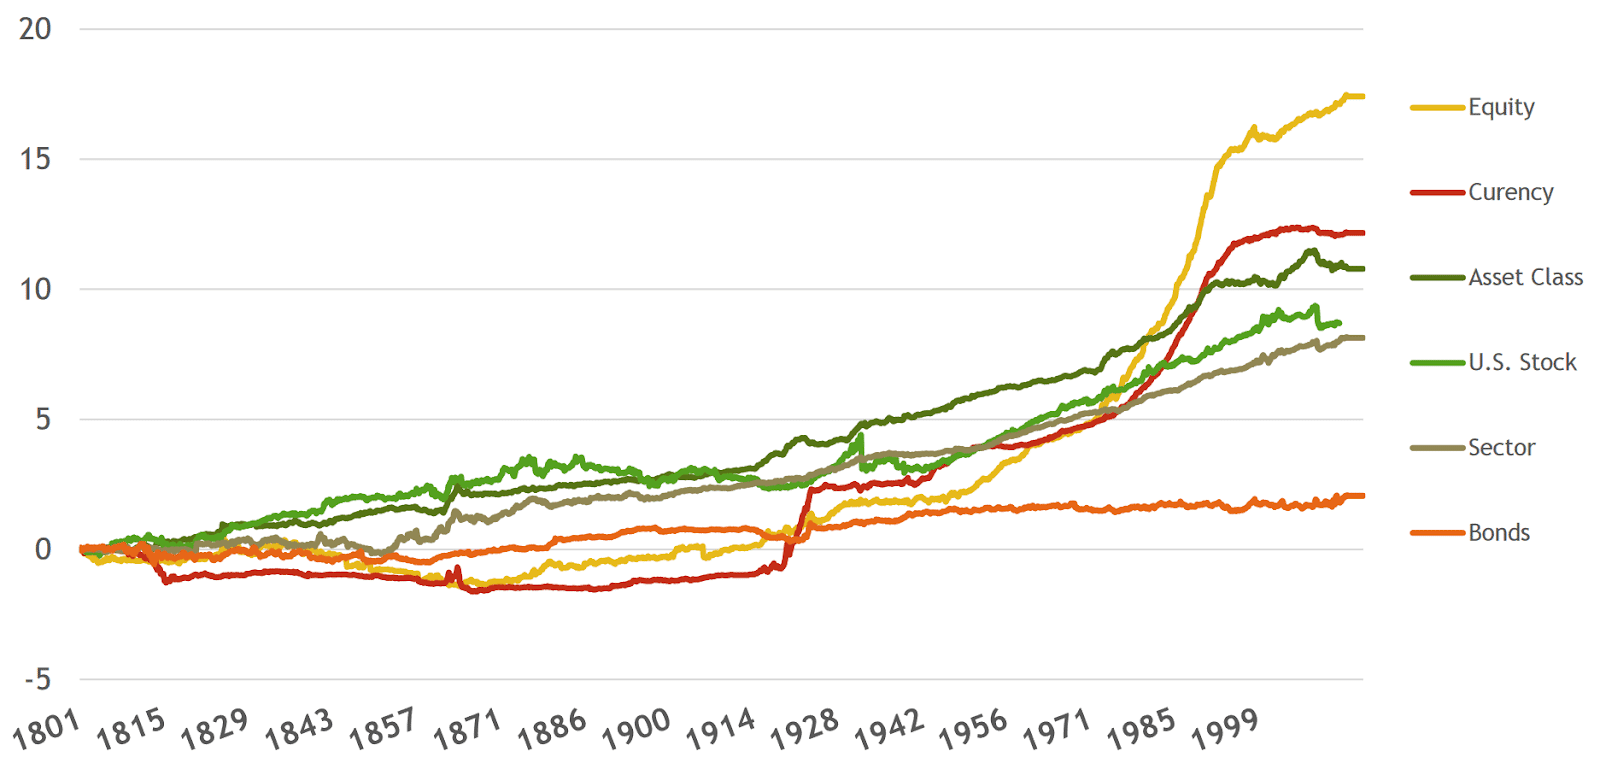
Source: Geczy & Samonov (2015)
Here is an example of that. About half the capitalization of global equities is in U.S. stocks. The other half is in non-U.S. stocks. We can compare the performance of the S&P 500, representing U.S. stocks, to the MSCI ACWI ex-US, representing the rest of the world. Each month we invest in whichever of the two had better performance during the past 12 months.
We use a 12-month look back that was found to work by Cowles and Jones in 1937. Data mining is not an issue since we are using a long-established model parameter for the lookback period. We need not worry about selection bias since we are using all areas of the world. There is on average less than one trade per year. So there are no trading impact issues. Here are the results from 1971 when non-U.S. stock index data became available.
1/1971 to 3/2018 | S&P 500 | ACWI x-US | 50/50 | MOMENTUM |
CAGR | 10.7 | 10.3 | 10.7 | 12.3 |
Annual Std Dev | 15.1 | 17.2 | 14.6 | 15.7 |
Sharpe Ratio | 0.42 | 0.36 | 0.45 | 0.55 |
Worst Drawdown | -51.0 | -57.4 | -54.2 | -54.6 |
Results are hypothetical, are NOT an indicator of future results, and do NOT represent returns that any investor actually attained. Indexes are unmanaged, do not reflect management or trading fees, and one cannot invest directly in an index. Positions are rebalanced monthly. Please see our Disclaimer page for more information.
This simple momentum model is always invested in stocks, so there is little tracking error. The momentum strategy shows an increase in the annual return of 160 basis points versus both the S&P 500 and a 50/50 U.S./non-U.S. allocation. Most investment managers would be happy over the long-run to outperform the market by 160 bps annually with comparable risk. Yet no one, as far as I know, is using this simple momentum strategy.
Neither my study nor Geczy and Samonov’s research take into account the price impact of trading. This may have made momentum applied to equity index investing even more attractive than momentum applied to individual stocks.
There is considerable controversy regarding trading impact costs when momentum is applied to individual stocks. See here for details. For whatever reason, stock momentum profits have been insignificant since the late 1990s according to this study and since the early 1990s according to this study. The length of this underperformance goes beyond normal tracking error.
Despite the issues of price impact, long-term stock momentum underperformance, and the superiority of momentum when used with geographic indices, most momentum funds use momentum with individual stocks. One cannot help but wonder why this is so.
It may be for the same reasons momentum works. These include the slow diffusion of information (research results), anchoring to prior beliefs, and herding. There may also be home country and familiarity biases.
2) “Momentum is best used on a relative strength, cross-sectional basis.”
There is plenty of research on cross-sectional, relative momentum that compares the performance of assets to one another. All momentum research between 1993 and 2010 was of this type. It was not until 2012 that Moskowitz, Oii, and Pedersen published a paper called “Time Series Momentum.” In early 2013, I released a paper called “Absolute Momentum: A Simple Rule-Based Strategy and Universal Trend Following Overlay.”
Absolute momentum is a form of trend following based on autocorrelation. It assumes assets that have been strong over time will continue to be strong.
Absolute momentum is as universal and consistent as relative momentum. Using at least 25 years of data applied to equity index, currency, and commodity futures, Moskowitz et al. showed persistent returns for absolute momentum. They found it performed best in extreme markets and had little exposure to standard asset pricing factors. This gives it considerable value as a portfolio diversifier.
My paper applied absolute momentum to stock index, bond index, real asset, stock/bond balanced, and risk parity portfolios. It showed that absolute momentum can help identify regime change and add value as both a stand-alone strategy and as a portfolio overlay.
In their 2012 paper, “A Century of Evidence on Trend-Following Investing,” Hurst, Oii, and Pedersen applied absolute momentum to equity indices, bond indices, commodity futures, and currencies. They found it was consistently profitable ever since 1903.
The amount of research done on absolute momentum has been catching up with relative momentum. If you do a search on “time-series momentum” (the preferred academic term) on SSRN, you will find over 200 papers.
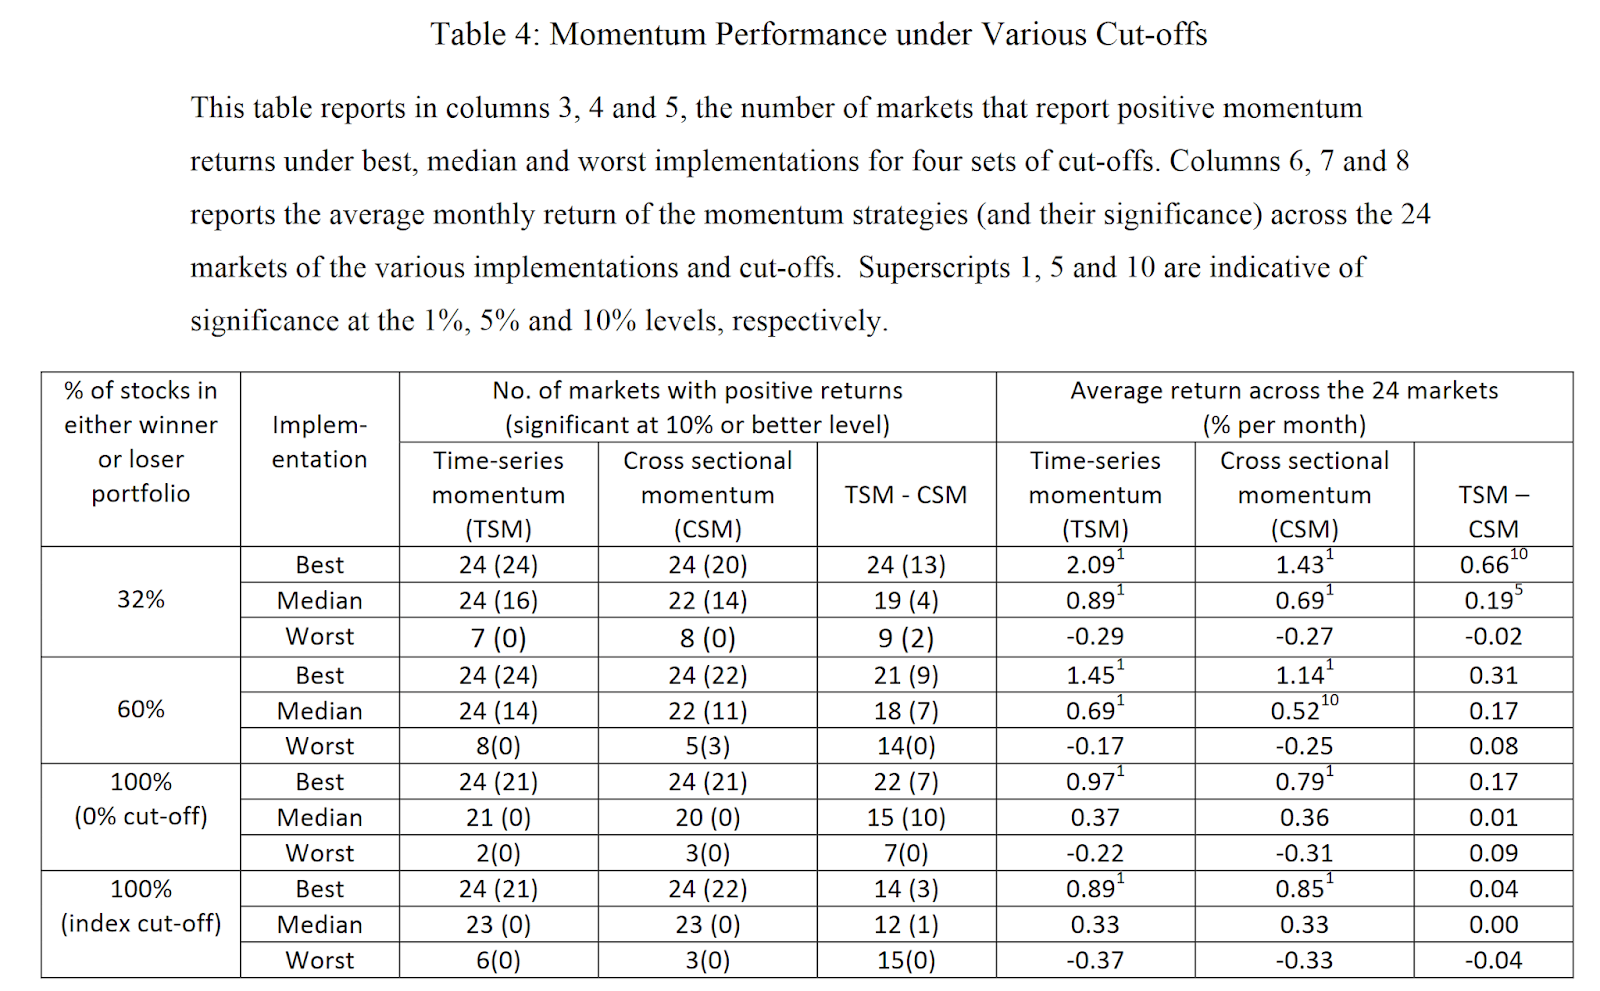
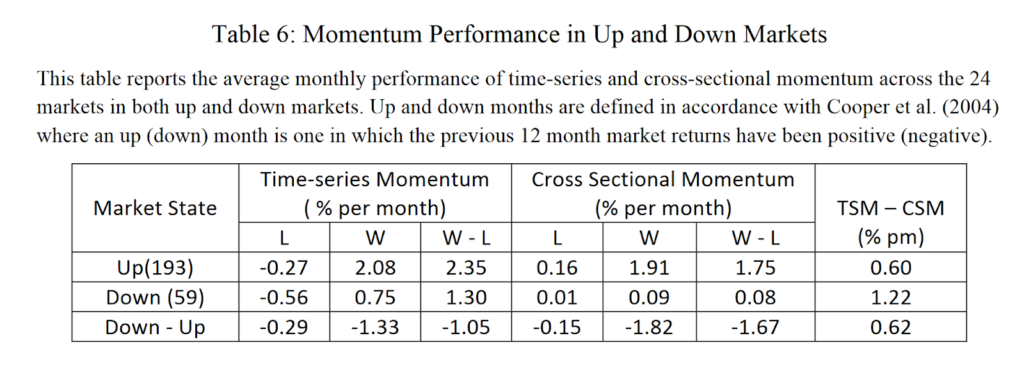
One might wonder whether relative or absolute momentum gives better results. Bird, Gao, and Yeung (2017) in their “Time Series and Cross-Sectional Momentum Strategies Under Alternative Implementation Strategies” applied relative and absolute long/short momentum to stocks in 24 developed markets from 1990 to 2012. They found positive returns from both forms of momentum. But they concluded that “time-series momentum is clearly superior,” and “momentum is best implemented using time-series momentum.”
 On the other hand, Goyal and Jegadeesh (2017) concluded that relative and absolute momentum performed similarly for individual stocks after adjusting for time-varying net long investment.
D’Souza, Srichanachaichok, Wang, and Yao (2017), in their “The Enduring Effect of Time-Series Momentum on Stock Returns Over Nearly 100-Years”, studied long/short absolute momentum in U.S. stocks from 1927 to 2014 and in international stocks since 1975. They found absolute momentum could entirely account for relative momentum. Absolute momentum performed well in both up and down markets. Unlike relative momentum, absolute momentum did not suffer from January losses and market crashes.
Despite the evidence that absolute momentum performs at least as well as relative momentum, most momentum funds use only relative momentum. The reasons for this may be the same as to why investors prefer momentum with stocks instead of indices – the slow diffusion of research results and anchoring that overweights prior research. But there may also be other reasons. First, there is a long-standing bias against tactical approaches like trend following. What many don’t realize is that all momentum is a form of trend following. Relative momentum looks at trends between assets. Absolute momentum looks at the trend of an asset itself over time.
Another reason absolute momentum has not been as well-received may be tracking error, especially in bull markets. Absolute momentum is known to outperform in bear markets. But in bull markets, whipsaw losses and trading lags can constrain the performance of absolute momentum. That is why some advisors use trend following only for modest-size satellite positions within their portfolios.
There is no way to eliminate all tracking error. But I show in my post “Why Does Dual Momentum Outperform” that dual momentum can lead to superior long-run performance in both bull and bear markets. Relative momentum can boost returns during bull markets. This can compensate for the whipsaw losses and performance lags of absolute momentum then. Absolute momentum can reduce the downside exposure of relative momentum during bear markets. In my 2012 paper, I introduced this concept I called dual momentum.
D’Souza et al. looked at both forms of momentum individually, as well as dual momentum. They found that dual momentum applied to long-short stock portfolios generated striking returns of 1.88% per month.
3) “Momentum (trend following) is not as reliable as diversification in reducing risk.”
The first thing we need to understand is that momentum is all about diversification. Momentum diversifies by time as well as by asset class. This makes it adaptive to changing market conditions. Traditional fixed diversification creates a drag on performance from poorer performing assets. For example, many investors use bonds to reduce the volatility of an all-stock portfolio. But bonds (and most other assets) have a lower long-run expected return than stocks. This creates a drag on portfolio performance.
Momentum can reduce performance drag by being only in assets when they are performing well. Here is an example comparing the performance of momentum versus a diversified fixed portfolio, the Ivy 5 developed by Meb Faber. Ivy 5 holds equal size positions in indices of U.S. stocks, foreign developed stocks, intermediate bonds, REITs, and commodities
For momentum, we use the Global Equities Momentum (GEM) model featured in my book. GEM uses 3 assets and holds one at a time. It decides whether to be in stocks or bonds based on absolute momentum. When stocks are selected, it chooses either the S&P 500 or the MSCI All Country World Index (ACWI) ex-U.S. based on relative momentum.
Stocks have shown the highest risk premium of any asset class. That is why we want to be in them as much as possible, providing their trend is positive. As you can see, dual momentum has done a better job in both reducing tail risk and improving risk-adjusted return.
1/1973 to 4/2018 | IVY 5 | GEM |
CAGR | 9.4 | 16.1 |
Annual Std Dev | 11.0 | 12.2 |
Sharpe Ratio | 0.40 | 0.89 |
Worst Drawdown | -47.3 | -17.8 |
Results are hypothetical, are NOT an indicator of future results, and do NOT represent returns that any investor actually attained. Indexes are unmanaged, do not reflect management or trading fees, and one cannot invest directly in an index. Please see our Disclaimer and Performance pages for more information.
There are some who criticize trend-following and systematic trading approaches because of what they call “timing luck”. With some strategies, results vary a lot depending on what day of the month you rebalance your positions. This uncertainty may cause some investors to trade portions of their portfolios at different times during the month (tranching). It also leads to doubts regarding the efficacy of systematic trading. It may also lead to more emphasis on traditional diversification.
Swinkels and van Vliet (2010) showed that stocks exhibit a statistically significant turn-of-the-month effect. The last trading day of the month and the first few trading days of the next month outperform other days. This may be due to institutional portfolio rebalancing at or just before month-end. Rebalancing replaces poor-performing stocks with better-performing ones. It is sometimes called “window dressing.”
Momentum means persistence in performance. We want to be in portfolios after better-performing stocks have replaced the laggards. This lets momentum work in our favor.
Our dual momentum models, which are most of the time in stock indices, do better by rebalancing early in the month. This lets us exploit the turn-of-the-month momentum effect to our advantage. Here are the Sharpe and Sortino ratios of the dual momentum GEM model since 1988 based on which trading day of the month is used for rebalancing. 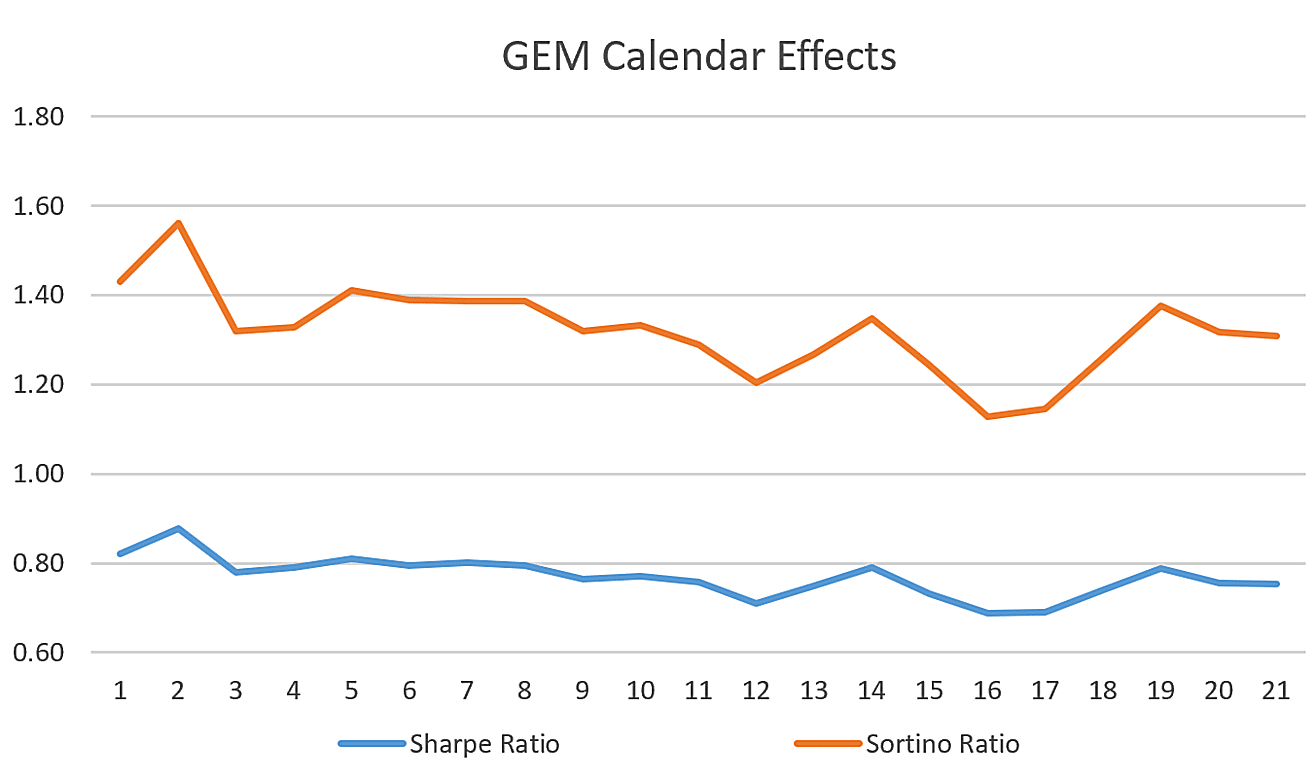
Results are hypothetical, are NOT an indicator of future results, and do NOT represent returns that any investor actually attained. Indexes are unmanaged, do not reflect management or trading fees, and one cannot invest directly in an index. Please see our Disclaimer and Performance pages for more information
We see that the first and second trading days of the month have the highest Sharpe and Sortino ratios. These days are consistent with the turn-of-the month effect.
If investors and advisors studied more of the literature on momentum and trend following, they would surely be impressed. Besides the research mentioned above, here are a few other studies that the points we have made. Clare et al. (2014) in “Size Matters: Tail Risk, Momentum, and Trend Following in International Equity Portfolios” looked at 20 developed and 12 developing countries from 1995 through 2013. They found limited evidence for the outperformance of relative momentum stock portfolios. Trend following though was observed to be a very effective strategy delivering superior risk-adjusted returns.
Geczy and Samonov (2015) showed the effectiveness of absolute as well as relative momentum on over 200 years of data. Lemperiere et al. (2014) in “Two Centuries of Trend Following,” looked at trend following across commodities, currencies, stock indices, and bonds since 1800. They found “the existence of trends one of the most significant anomalies in financial markets.” Their results were very stable across time and asset classes.
For those wanting even more history, Greyserman and Kaminsky (2014) in Trend Following with Managed Futures took trend following back 800 years! When applied to 84 different markets, absolute momentum showed a Sharpe ratio of 1.16 versus 0.47 for buy-and-hold. The worst drawdown of trend following was 25% less than buy-and-hold. The duration of its longest drawdown and the average duration of the longest five drawdowns were 90% and 80% shorter. The authors found trend following to have a low correlation with traditional asset classes, interest rate regimes, and inflation. It has also provided consistently positive performance during crisis periods.